There is something wonderful about time at sea, where your primary obligation is to observe the ocean from sunrise to sunset, day after day, scanning for signs of life. After hours of seemingly empty blue with only an occasional albatross gliding over the swells on broad wings, it is easy to question whether there is life in the expansive, blue, offshore desert. Splashes on the horizon catch your eye, and a group of dolphins rapidly approaches the ship in a flurry of activity. They play in the ship’s bow and wake, leaping out of the swells. Then, just as quickly as they came, they move on. Back to blue, for hours on end… until the next stirring on the horizon. A puff of exhaled air from a whale that first might seem like a whitecap or a smudge of sunscreen or salt spray on your sunglasses. It catches your eye again, and this time you see the dark body and distinctive dorsal fin of a humpback whale.
Figure 1. Pacific white-sided dolphins (Lagenorhynchus obliquidens) play in the big swell and surf the wake of the NOAA ship Bell M. Shimada off Coos Bay, Oregon. Photos: Dawn Barlow.
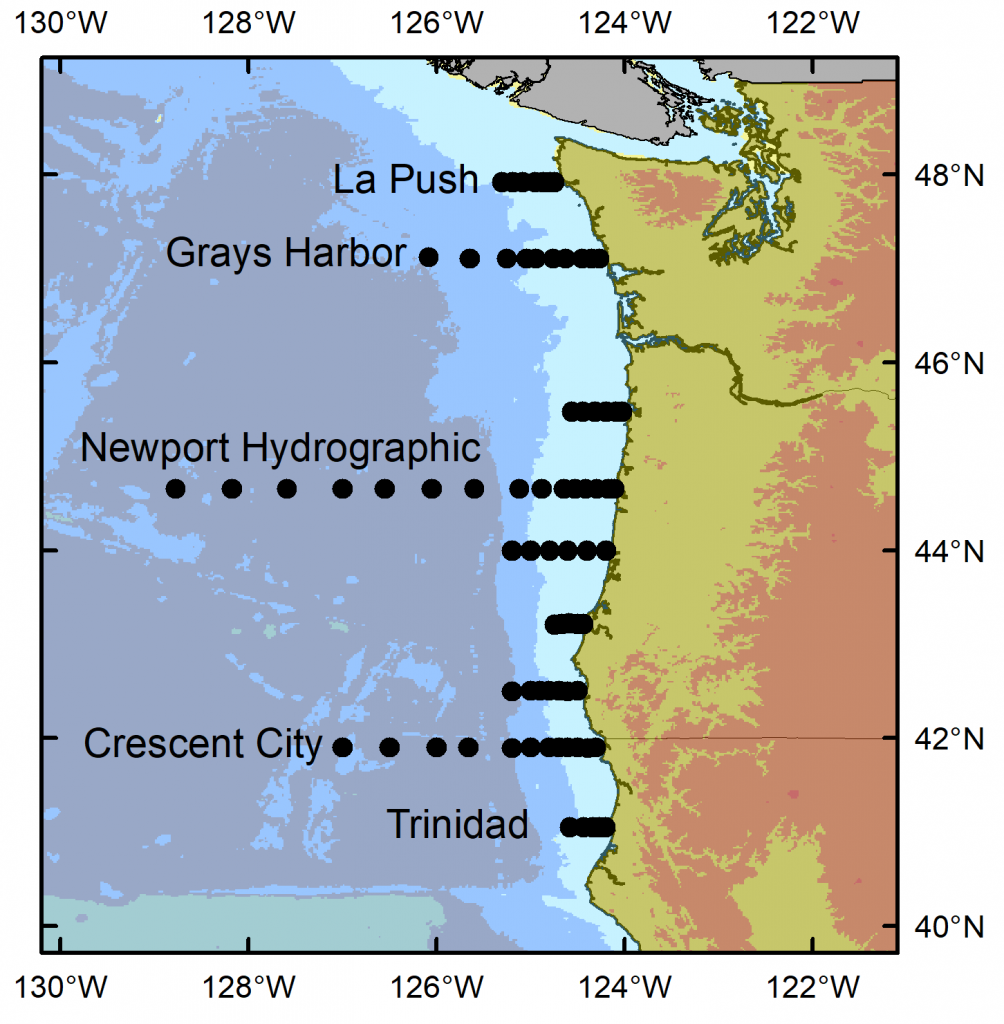
I have just returned from 10 days aboard the NOAA ship Bell M. Shimada, where I was the marine mammal observer on the Northern California Current (NCC) Cruise. These research cruises have sampled the NCC in the winter, spring, and fall for decades. As a result, a wealth of knowledge on the oceanography and plankton community in this dynamic ocean ecosystem has been assimilated by a dedicated team of scientists (find out more via the Newportal Blog). Members of the GEMM Lab have joined this research effort in the past two years, conducting marine mammal surveys during the transits between sampling stations (Fig. 2).
Figure 2. Northern California Current cruise sampling locations, where oceanography and plankton data are collected. Marine mammal surveys were conducted on the transits between stations.
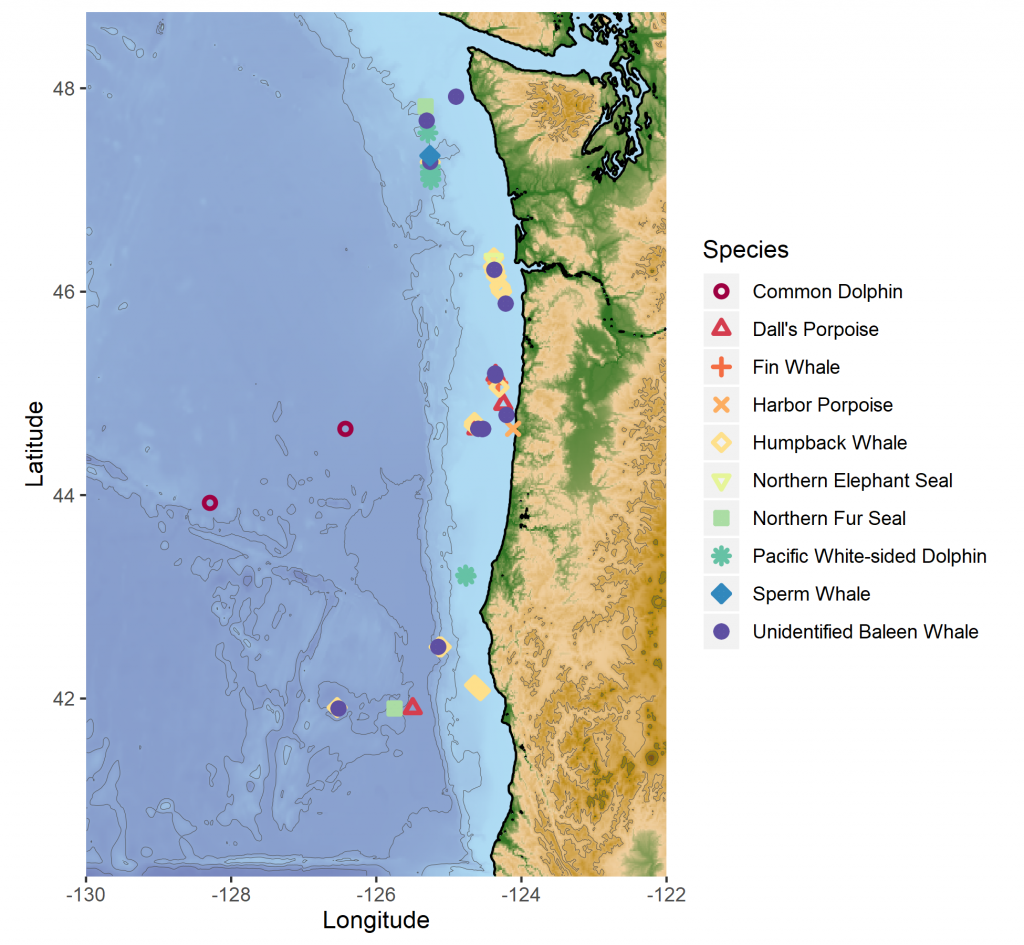
The fall 2019 NCC cruise was a resounding success. We were able to survey a large swath of the ecosystem between Crescent City, CA and La Push, WA, from inshore to 200 miles offshore. During that time, I observed nine different species of marine mammals (Table 1). As often as I use some version of the phrase “the marine environment is patchy and dynamic”, it never fails to sink in a little bit more every time I go to sea. On the map in Fig. 3, note how clustered the marine mammal sightings are. After nearly a full day of observing nothing but blue water, I would find myself scrambling to keep up with recording all the whales and dolphins we were suddenly in the midst of. What drives these clusters of sightings? What is it about the oceanography and prey community that makes any particular area a hotspot for marine mammals? We hope to get at these questions by utilizing the oceanographic data collected throughout the surveys to better understand environmental drivers of these distribution patterns.
Table 1. Summary of marine mammal
sightings from the September 2019 NCC Cruise.
Species
# sightings
Total # individuals
Northern Elephant Seal
1
1
Northern Fur Seal
2
2
Common Dolphin
2
8
Pacific White-sided Dolphin
8
143
Dall’s Porpoise
4
19
Harbor Porpoise
1
3
Sperm Whale
1
1
Fin Whale
1
1
Humpback Whale
22
36
Unidentified Baleen Whale
14
16
Figure 3. Map of marine mammal sighting locations from the September NCC cruise.
It was an auspicious time to survey the Northern California Current. Perhaps you have read recent news reports warning about the formation of another impending marine heatwave, much like the “warm blob” that plagued the North Pacific in 2015. We experienced it first-hand during the NCC cruise, with very warm surface waters off Newport extending out to 200 miles offshore (Fig. 4). A lot of energy input from strong winds would be required to mix that thick, warm layer and allow cool, nutrient-rich water to upwell along the coast. But it is already late September, and as the season shifts from summer to fall we are at the end of our typical upwelling season, and the north winds that would typically drive that mixing are less likely. Time will tell what is in store for the NCC ecosystem as we face the onset of another marine heatwave.
Figure 4. Temperature contours over the upper 150 m from 1-200 miles off Newport, Oregon from Fall 2014-2019. During Fall 2014, the Warm Blob inundated the Oregon shelf. Surface temperatures during that survey were 17°- 18°C along the entire transect. During 2015 and 2016 the warm water (16°C) layer had deepened and occupied the upper 50 m. During 2018, the temperature was 16°C in the upper 20 m and cooler on the shelf, indicative of residual upwelling. During this survey in 2019, we again saw very warm (18°C) temperatures in the upper water column over the entire transect. Image and caption credit: Jennifer Fisher.
It was a joy to spend 10 days at sea with this team of scientists. Insight, collaboration, and innovation are born from interdisciplinary efforts like the NCC cruises. Beyond science, what a privilege it is to be on the ocean with a group of people you can work with and laugh with, from the dock to 200 miles offshore, south to north and back again.
Dawn Barlow on the flying bridge of NOAA Ship Bell M. Shimada, heading out to sea with the Newport bridge in the background. Photo: Anna Bolm.
By: Alexa Kownacki, Ph.D. Student, OSU Department of Fisheries and Wildlife, Geospatial Ecology of Marine Megafauna Lab
Marine mammals are challenging to study for many reasons, and
specifically because they inhabit the areas of the Earth that are uninhabited
by people: the oceans. Monitoring marine mammal populations to gather baselines
on their health condition and reproductive status is not as simple as trap and
release, which is a method often conducted for terrestrial animals. Marine
mammals are constantly moving in vast areas below the surface. Moreover,
cetaceans, which do not spend time on land, are arguably the most challenging
to sample.
One component of my project, based in California, USA, is a health assessment analyzing hormones of the bottlenose dolphins that frequent both the coastal and the offshore waters. Therefore, I am all too familiar with the hurdles of collecting health data from living marine mammals, especially cetaceans. However, the past few decades have seen major advancements in technology both in the laboratory and with equipment, including one tool that continues to be critical in understanding cetacean health: blubber biopsies.
Biopsy dart hitting a bottlenose dolphin below the dorsal fin. Image Source: NMFS
Blubber biopsies are typically obtained via low-powered crossbow with a bumper affixed to the arrow to de-power it once it hits the skin. The arrow tip has a small, pronged metal attachment to collect an eraser-tipped size amount of tissue with surface blubber and skin. I compare this to a skin punch biopsies in humans; it’s small, minimally-invasive, and requires no follow-up care. With a small team of scientists, we use small, rigid-inflatable vessels to survey the known locations of where the bottlenose dolphins tend to gather. Then, we assess the conditions of the seas and of the animals, first making sure we are collecting from animals without potentially lowered immune systems (no large, visible wounds) or calves (less than one years old). Once we have photographed the individual’s dorsal fin to identify the individual, one person assembles the biopsy dart and crossbow apparatus following sterile procedures when attaching the biopsy tips to avoid infection. Another person prepares to photograph the animal to match the biopsy information to the individual dolphin. One scientist aims the crossbow for the body of the dolphin, directly below the dorsal fin, while the another photographs the biopsy dart hitting the animal and watches where it bounces off. Then, the boat maneuvers to the floating biopsy dart to recover the dart and the sample. Finally, the tip with blubber and skin tissue is collected, again using sterile procedures, and the sample is archived for further processing. A similar process, using an air gun instead of a crossbow can be viewed below:
GEMM Lab members using an air gun loaded with a biopsy dart to procure marine mammal blubber from a blue whale in New Zealand. Video Source: GEMM Laboratory.
Part of the biopsy process is holding ourselves to the highest standards in our minimally-invasive technique, which requires constant practice, even on land.
Alexa practicing proper crossbow technique on land under supervision. Image Source: Alexa Kownacki
Blubber is the lipid-rich, vascularized tissue under the
epidermis that is used in thermoregulation and fat storage for marine mammals. Blubber
is an ideal matrix for storing lipophilic (fat-loving) steroid hormones because
of its high fat content. Steroid hormones, such as cortisol, progesterone, and
testosterone, are naturally circulating in the blood stream and are released in
high concentrations during specific events. Unlike blood, blubber is less
dynamic and therefore tells a much longer history of the animal’s nutritional
state, environmental exposure, stress level, and life history status. Blubber
is the cribs-notes version of a marine mammal’s biography over its previous few
months of life. Blood, on the other hand, is the news story from the last 24
hours. Both matrices serve a specific purpose in telling the story, but blubber
is much more feasible to obtain from a cetacean and provides a longer time
frame in terms of information on the past.
A simplified depiction of marine mammal blubber starting from the top (most exterior surface) being the skin surface down to the muscle (most interior). Image Source: schoolnet.org.za
I use blubber biopsies for assessing cortisol, testosterone,
and progesterone in the bottlenose dolphins. Cortisol is a glucocorticoid that
is frequently associated with stress, including in humans. Marine mammals
utilize the same hypothalamic-pituitary-adrenal (HPA) axis that is responsible
for the fight-or-flight response, as well as other metabolic regulations.
During prolonged stressful events, cortisol levels will remain elevated, which
has long-term repercussions for an animal’s health, such as lowered immune
systems and decreased ability to respond to predators. Testosterone and
progesterone are sex hormones, which can be used to indicate sex of the
individual and determine reproductive status. This reproductive information
allows us to assess the population’s composition and structure of males and
females, as well as potential growth or decline in population (West et al.
2014).
Alexa using a crossbow from a small boat off of San Diego, CA. Image Source: Alexa Kownacki
The coastal and offshore bottlenose dolphin ecotypes of interest in my research occupy different locations and are therefore exposed to different health threats. This is a primary reason for conducting health assessments, specifically analyzing blubber hormone levels. The offshore ecotype is found many kilometers offshore and is most often encountered around the southern Channel Islands. In contrast, the coastal ecotype is found within 2 kilometers of shore (Lowther-Thieleking et al. 2015) where they are subjected to more human exposure, both directly and indirectly, because of their close proximity to the mainland of the United States. Coastal dolphins have a higher likelihood of fishery-related mortality, the negative effects of urbanization including coastal runoff and habitat degradation, and recreational activities (Hwang et al. 2014). The blubber hormone data from my project will inform which demographics are most at-risk. From this information, I can provide data supporting why specific resources should be allocated differently and therefore help vulnerable populations. Further proving that the small amount of tissue from a blubber biopsy can help secure a better future for population by adjusting and informing conservation strategies.
Literature Cited:
Hwang, Alice, Richard H Defran, Maddalena Bearzi, Daniela. Maldini, Charles A Saylan, Aime ́e R Lang, Kimberly J Dudzik, Oscar R Guzo n-Zatarain, Dennis L Kelly, and David W Weller. 2014. “Coastal Range and Movements of Common Bottlenose Dolphins (Tursiops Truncatus) off California and Baja California, Mexico.” Bulletin of the Southern California Academy of Sciences 113 (1): 1–13. https://doi.org/10.3390/toxins6010211.
Lowther-Thieleking, Janet L.,
Frederick I. Archer, Aimee R. Lang, and David W. Weller. 2015. “Genetic
Differentiation among Coastal and Offshore Common Bottlenose Dolphins, Tursiops
Truncatus, in the Eastern North Pacific Ocean.” Marine Mammal Science 31
(1): 1–20. https://doi.org/10.1111/mms.12135.
West, Kristi L., Jan Ramer, Janine L. Brown, Jay Sweeney, Erin M. Hanahoe, Tom Reidarson, Jeffry Proudfoot, and Don R. Bergfelt. 2014. “Thyroid Hormone Concentrations in Relation to Age, Sex, Pregnancy, and Perinatal Loss in Bottlenose Dolphins (Tursiops Truncatus).” General and Comparative Endocrinology 197: 73–81. https://doi.org/10.1016/j.ygcen.2013.11.021.
By Karen Lohman, Masters Student in Wildlife Science, Cetacean Conservation and Genomics Lab, Oregon State University
My name is Karen Lohman, and I’m a first-year student in Dr. Scott Baker’s Cetacean Conservation and Genomics Lab at OSU. Dr. Leigh Torres is serving on my committee and has asked me to contribute to the GEMM lab blog from time to time. For my master’s project, I’ll be applying population genetics and genomics techniques to better understand the degree of population mixing and breeding ground assignment of feeding humpback whales in the eastern North Pacific. In other words, I’ll be trying to determine where the humpback whales off the U.S. West Coast are migrating from, and at what frequency.
Earlier this month I joined the GEMM lab members in attending the Northwest Student Society of Marine Mammalogy Conference in Seattle. The GEMM lab members and I made the trip up to the University of Washington to present our work to our peers from across the Pacific Northwest. All five GEMM lab graduate students, plus GEMM lab intern Acacia Pepper, and myself gave talks presenting our research to our peers. I was able to present preliminary results on the population structure of feeding humpback whales across shared feeding habitat by multiple breeding groups in the eastern North Pacific using mitochondria DNA haplotype frequencies. In the end GEMM lab’s Dawn Barlow took home the “Best Oral Presentation” prize. Way to go Dawn!
A few of the GEMM lab members and me presenting our research at the NWSSMM conference in May 2019 at the University of Washington.
While conferences have a strong networking component, this one feels unique. It is a chance to network with our peers, who are working through the same challenges in graduate school and will hopefully be our future research collaborators in marine mammal research when we finish our degrees. It’s also one of the few groups of people that understand the challenges of studying marine mammals. Not every day is full of dolphins and rainbows; for me, it’s mostly labwork or writing code to overcome small and/or patchy sample size problems.
All of the CCGL and GEMM Lab members excited to hear Dr. Sylvia Earle’s presentation at Portland State University in May 2019 (from L to R: Karen L., Lisa H., Alexa K., Leila L., Dawn B., and Dom K.) . Photo Source: Alexa Kownacki
On the way back from Seattle we stopped to hear the one and only Dr. Sylvia Earle, talk in Portland. With 27 honorary doctorates and over 200 publications, Dr. Sylvia Earle is a legend in marine science. Hearing a distinguished marine researcher talk about her journey in research and to present such an inspiring message of ocean advocacy was a great way to end our weekend away from normal grad school responsibilities. While the entirety of her talk was moving, one of her final comments really stood out. Near the end of her talk she called the audience to action by saying “Look at your abilities and have confidence that you can and must make a difference. Do whatever you’ve got.” As a first-year graduate student trying to figure out my path forward in research and conservation, I couldn’t think of better advice to end the weekend on.
By: Alexa Kownacki, Ph.D. Student, OSU Department of Fisheries and Wildlife, Geospatial Ecology of Marine Megafauna Lab
For the past two years, I’ve had the opportunity to be the marine mammal observer aboard the NOAA ship Bell M. Shimada for 10 days in May. Both trips covered transects in the Northern California Current Ecosystem during the same time of year, but things looked very different from my chair on the fly bridge. This trip, in particular, highlighted the importance of standardization, seeing as it was the second replicate of the same area. Other scientists and crew members repeatedly asked me the same questions that made me realize just how important it is to have standards in scientific practices and communicating them.
Northern right whale dolphin porpoising out of the water beside the ship while in transit. May 2019. Image source: Alexa Kownacki
The questions:
What do you actually do here and why are you doing it?
Is this year the same as last year in terms of weather, sightings, and transect locations?
Did you expect to see greater or fewer sightings (number and diversity)?
What is this Beaufort Sea State scale that you keep referring to?
All of these are important scientific questions that influence our hypothesis-testing research, survey methods, expected results, and potential conclusions. Although the entire science party aboard the ship conducted marine science, we all had our own specialties and sometimes only knew the basics, if that, about what the other person was doing. It became a perfect opportunity to share our science and standards across similar, but different fields.
Now, to answer those questions:
a) What do you actually do here and b) why are you doing it?
a) As the only marine mammal observer, I stand watch during favorable weather conditions while the ship is in transit, scanning from 0 to 90 degrees off the starboard side (from the front of the ship to a right angle towards the right side when facing forwards). Meanwhile, an application on an iPad called SeaScribe, records the ship’s exact location every 15 seconds, even when no animal is sighted. This process allows for the collection of absence data, that is, data when no animals are present. The SeaScribe program records the survey lines, along with manual inputs that I add, including weather and observer information. When I spot a marine mammal, I immediately mark an exact location on a hand held GPS, use my binoculars to identify the species, and add information to the sighting on the SeaScribe program, such as species, distance to the sighted animal(s), the degree (angle) to the sighting, number of animals in a group, behavior, and direction if traveling.
b) Marine mammal observing serves many different purposes. In this case, observing collects information about what species are where at what time. By piggy-backing on these large-scale, offshore oceanographic NOAA surveys, we have the unique opportunity to survey along standardized transect lines during different times of the year. From replicate survey data, we can start to form an idea of which species use which areas and what oceanographic conditions may impact species distributions. Currently there is not much consistent marine mammal data collected over these offshore areas between Northern California and Washington State, so our work is aiming to fill this knowledge gap.
Alexa observing on the R/V Shimada in May 2019, all bundled up. Image Source: Alexa Kownacki
What is this Beaufort Sea State scale that you keep referring to?
Great question! It took me a while to realize that this standard measuring tool to estimate wind speeds and sea conditions, is not commonly recognized even among other sea-goers. The Beaufort Sea State, or BSS, uses an empirical scale that ranges from 0-12 with 0 being no wind and calm seas, to 12 being hurricane-force winds with 45+ ft seas. It is frequently referenced by scientists in oceanography, marine science, and climate science as a universally-understood metric. The BSS was created in 1805 by Francis Beaufort, a hydrographer in the Royal Navy, to standardize weather conditions across the fleet of vessels. By the mid-1850s, the BSS was standardized to non-naval use for sailing vessels, and in 1916, expanded to include information specific to the seas and not the sails1. We in the marine mammal observation field constantly collect BSS information while on survey to measure the quality of survey conditions that may impact our observations. BSS data allows us to measure the extent of our survey range, both in the distance that we are likely to sight animals and also the likelihood of sighting anything. Therefore, the BSS scale gives us an important indication of how much absence data we have collected, in addition to presence data.
A description of the Beaufort Sea State Scale. Image source: National Weather Service.
Is this year the same as last year in terms of weather, sightings, and transect locations?
The short answer is no. Observed differences in marine mammal sightings in terms of both species diversity and number of animals between years can be normal. There are many potential explanatory variables, from differences in currents, upwelling strength, El Nino index levels, water temperatures, or, what was obvious in this case: sighting conditions. The weather in May 2019 varied greatly from that in May 2018. Last year, I observed for nearly every day because the Beaufort Sea State (BSS) was frequently less than a four. However, this year, more often than not, the BSS greater than or equal to five. A BSS of 5 equates to approximately 17-21 knots of breeze with 6-foot waves and the water appears to have many “white horses” or pronounced white caps with sea spray. Additionally, mechanical issue with winches delayed and altered our transect locations. Therefore, although multiple transects from May 2018 were also surveyed during May 2019, there were a few lines that do not have data for both cruises.
May 2018 with a BSS 1
May 2019 with a BSS 6
Did you expect to see greater or fewer sightings (number and diversity)?
Knowing that I had less favorable sighting conditions and less amount of effort observing this year, it is not surprising that I observed fewer marine mammals in total count and in species diversity. Even less surprising is that on the day with the best weather, where the BSS was less than a five, I recorded the most sightings with the highest species count. May 2018 felt a bit like a tropical vacation because we had surprisingly sunny days with mild winds, and during May 2019 we had some rough seas with gale force winds. Additionally, as an observer, I need to remove as much bias as possible. So, yes, I had hoped to see beaked whales or orca like I did in May 2018, but I was still pleasantly surprised when I spotted fin whales feeding in May 2019.
Standardization is a common theme. Observing between years on standard transects, at set speeds, in different conditions using standardized tools is critical to collecting high quality data that is comparable across different periods. Scientists constantly think about quality control. We look for trends and patterns, similarities and differences, but none of those could be understood without having standard metrics.
The entire science party aboard the R/V Shimada in May 2019, including a marine mammal scientist, phytoplankton scientists, zooplankton scientists, and fisheries scientists, and oceanographers. Image Source: Alexa Kownacki
Literature Cited:
1Oliver, John E. (2005). Encyclopedia of world climatology. Springer.
By Alexa Kownacki, Ph.D. Student, OSU Department of Fisheries and Wildlife, Geospatial Ecology of Marine Megafauna Lab
Data wrangling, in my own loose definition, is the necessary combination of both data selection and data collection. Wrangling your data requires accessing then assessing your data. Data collection is just what it sounds like: gathering all data points necessary for your project. Data selection is the process of cleaning and trimming data for final analyses; it is a whole new bag of worms that requires decision-making and critical thinking. During this process of data wrangling, I discovered there are two major avenues to obtain data: 1) you collect it, which frequently requires an exorbitant amount of time in the field, in the lab, and/or behind a computer, or 2) other people have already collected it, and through collaboration you put it to a good use (often a different use then its initial intent). The latter approach may result in the collection of so much data that you must decide which data should be included to answer your hypotheses. This process of data wrangling is the hurdle I am facing at this moment. I feel like I am a data detective.
Data wrangling illustrated by members of the R-programming community. (Image source: R-bloggers.com)
My project focuses on assessing the health conditions of the two ecotypes of bottlenose dolphins between the waters off of Ensenada, Baja California, Mexico to San Francisco, California, USA between 1981-2015. During the government shutdown, much of my data was inaccessible, seeing as it was in possession of my collaborators at federal agencies. However, now that the shutdown is over, my data is flowing in, and my questions are piling up. I can now begin to look at where these animals have been sighted over the past decades, which ecotypes have higher contaminant levels in their blubber, which animals have higher stress levels and if these are related to geospatial location, where animals are more susceptible to human disturbance, if sex plays a role in stress or contaminant load levels, which environmental variables influence stress levels and contaminant levels, and more!
Alexa, alongside collaborators, photographing transiting bottlenose dolphins along the coastline near Santa Barbara, CA in 2015 as part of the data collection process. (Image source: Nick Kellar).
Over the last two weeks, I was emailed three separate Excel spreadsheets representing three datasets, that contain partially overlapping data. If Microsoft Access is foreign to you, I would compare this dilemma to a very confusing exam question of “matching the word with the definition”, except with the words being in different languages from the definitions. If you have used Microsoft Access databases, you probably know the system of querying and matching data in different databases. Well, imagine trying to do this with Excel spreadsheets because the databases are not linked. Now you can see why I need to take a data management course and start using platforms other than Excel to manage my data.
A visual interpretation of trying to combine datasets being like matching the English definition to the Spanish translation. (Image source: Enchanted Learning)
In the first dataset, there are 6,136 sightings of Common bottlenose dolphins (Tursiops truncatus) documented in my study area. Some years have no sightings, some years have fewer than 100 sightings, and other years have over 500 sightings. In another dataset, there are 398 bottlenose dolphin biopsy samples collected between the years of 1992-2016 in a genetics database that can provide the sex of the animal. The final dataset contains records of 774 bottlenose dolphin biopsy samples collected between 1993-2018 that could be tested for hormone and/or contaminant levels. Some of these samples have identification numbers that can be matched to the other dataset. Within these cross-reference matches there are conflicting data in terms of amount of tissue remaining for analyses. Sorting these conflicts out will involve more digging from my end and additional communication with collaborators: data wrangling at its best. Circling back to what I mentioned in the beginning of this post, this data was collected by other people over decades and the collection methods were not standardized for my project. I benefit from years of data collection by other scientists and I am grateful for all of their hard work. However, now my hard work begins.
The cutest part of data wrangling: finding adorable images of bottlenose dolphins, photographed during a coastal survey. (Image source: Alexa Kownacki).
There is also a large amount of data that I downloaded from federally-maintained websites. For example, dolphin sighting data from research cruises are available for public access from the OBIS (Ocean Biogeographic Information System) Sea Map website. It boasts 5,927,551 records from 1,096 data sets containing information on 711 species with the help of 410 collaborators. This website is incredible as it allows you to search through different data criteria and then download the data in a variety of formats and contains an interactive map of the data. You can explore this at your leisure, but I want to point out the sheer amount of data. In my case, the OBIS Sea Map website is only one major platform that contains many sources of data that has already been collected, not specifically for me or my project, but will be utilized. As a follow-up to using data collected by other scientists, it is critical to give credit where credit is due. One of the benefits of using this website, is there is information about how to properly credit the collaborators when downloading data. See below for an example:
Example citation for a dataset (Dataset ID: 1201):
Lockhart, G.G., DiGiovanni Jr., R.A., DePerte, A.M. 2014. Virginia and Maryland Sea Turtle Research and Conservation Initiative Aerial Survey Sightings, May 2011 through July 2013. Downloaded from OBIS-SEAMAP (http://seamap.env.duke.edu/dataset/1201) on xxxx-xx-xx.
Another federally-maintained data source that boasts more data than I can quantify is the well-known ERDDAP website. After a few Google searches, I finally discovered that the acronym stands for Environmental Research Division’s Data Access Program. Essentially, this the holy grail of environmental data for marine scientists. I have downloaded so much data from this website that Excel cannot open the csv files. Here is yet another reason why young scientists, like myself, need to transition out of using Excel and into data management systems that are developed to handle large-scale datasets. Everything from daily sea surface temperatures collected on every, one-degree of latitude and longitude line from 1981-2015 over my entire study site to Ekman transport levels taken every six hours on every longitudinal degree line over my study area. I will add some environmental variables in species distribution models to see which account for the largest amount of variability in my data. The next step in data selection begins with statistics. It is important to find if there are highly correlated environmental factors prior to modeling data. Learn more about fitting cetacean data to models here.
The ERDAPP website combined all of the average Sea Surface Temperatures collected daily from 1981-2018 over my study site into a graphical display of monthly composites. (Image Source: ERDDAP)
As you can imagine, this amount of data from many sources and collaborators is equal parts daunting and exhilarating. Before I even begin the process of determining the spatial and temporal spread of dolphin sightings data, I have to identify which data points have sex identified from either hormone levels or genetics, which data points have contaminants levels already quantified, which samples still have tissue available for additional testing, and so on. Once I have cleaned up the datasets, I will import the data into the R programming package. Then I can visualize my data in plots, charts, and graphs; this will help me identify outliers and potential challenges with my data, and, hopefully, start to see answers to my focal questions. Only then, can I dive into the deep and exciting waters of species distribution modeling and more advanced statistical analyses. This is data wrangling and I am the data detective.
What people may think a ‘data detective’ looks like, when, in reality, it is a person sitting at a computer. (Image source: Elder Research)
Like the well-known phrase, “With great power comes great responsibility”, I believe that with great data, comes great responsibility, because data is power. It is up to me as the scientist to decide which data is most powerful at answering my questions.
Data is information. Information is knowledge. Knowledge is power. (Image source: thedatachick.com)
By Courtney Hann (NOAA Fisheries, West Coast Sustainable Fisheries Division)
Thinking back, as Leigh’s first M.Sc. student for the GEMM Lab, I wonder what poignant insight could have prepared me for my future endeavors. And having faced years of perseverance and dedication in the face of professional unknowns, perhaps the answer is none at all; fore maybe it was the many unknown challenges met that led me to where I am today.
I graduated in December of 2015, with my Masters in Marine Resource Management, and stamped completion of my research with the GEMM Lab. While my research focused on marine mammals, my broader love for the Earth’s oceans and lands guided my determination to help keep our planet’s precious ecosystem resources wild and free. So when I landed a position in terrestrial ecology after graduating, I chose to embrace the challenging decision of jumping away from theoretical research and moving back towards applied research. Consequently, I fell in love with botany, moth identification, birding, and explored the unknowns of a whole new world of conservation biology in Scotland with the Royal Society for the Protection of Birds. Not only was this work incredibly fun, interesting, and spontaneous, it offered me an opportunity to take my knowledge of developing research projects and apply it to nature reserve management. Every survey I completed and dataset I analyzed provided information required to determine the next land management steps for maximizing the conservation of rare and diverse species. From the GEMM Lab, I brought skills on: how to work through what, at times, seemed like an impassible barrier, complete tasks efficiently under a tight deadline, juggle multiple activities and obligations, and still make time to ponder the importance of seeing the bigger picture, while having fun learning new things.
Above: Botanizing and birding in Scotland with the best botanist I have ever known and my boss, Jeff Waddell, with the Royal Society for the Protection of Birds.
For me, the long game of seeing the bigger picture has always been key. And at the end of the day, I remained steadfast in answering the questioned I posed myself: Why do all of this work if not to make a truly positive impact? With that in mind, and with an expiring visa, I moved back to the West Coast of the U.S. and landed a contracting position with NOAA Fisheries. Where I met my second female mentor, Heidi Taylor, who inspired me beyond words and introduced me to the amazing world of fisheries management. All the while, I kept working my second part-time job with the West Coast Regional Planning Body (now called the West Coast Ocean Alliance, WCOA). Working two jobs allowed me to not only accelerate my learning capacity through more opportunities, but also allowed me to extend the reach of growing a positive impact. For example, I learned about coordinating region-wide ocean management, facilitation of diverse groups, and working with tribes, states, and federal agencies while working for the WCOA. While there were moments that I struggled with overworking and fatigue, my training in graduate school to persevere really kicked in. Driven by the desire to attain a permanent position that complimented my talents and determination to provide sustained help for our Earth’s ecosystems, I worked for what sometimes felt endlessly to reach my goal. Getting there was tough, but well worth it!
One of the most challenging aspects for me was finishing my last publication for the GEMM Lab. I was no longer motivated by the research, since my career path had taken a different turn, and I was already burnt out form working overtime every week. Therefore, if it was not for Leigh’s encouraging words, the promise I made to her to complete the publication, and my other co-author’s invitation to submit a paper for a particular journal, then I likely would have thrown in the towel. I had to re-do the analysis several times, had the paper rejected once, and then ended up re-writing and re-structuring the entire paper for the final publication. In total, it took me two and half years and 100s of hours to complete this paper after graduating. Of course, there was no funding, so I felt a bit like an ongoing graduate student until the paper was finally accepted and the work complete. But the final acceptance of the paper was so sweet, and after years of uncertain challenges, a heavy weight had finally been lifted. So perhaps, if there is one piece of advice I would say to young graduate students, it is to get your work published before you graduate! I had one paper and one book chapter published before I graduated, and that made my life much easier. While I am proud for finishing the final third publication, I would have much preferred to have just taken one extra semester and finished that publication while in school. But regardless, it was completed. And in a catharsis moment, maybe the challenge of completing it taught me the determination I needed to persevere through difficult situations.
Above: Elephant seal expressing my joy of finishing that last publication! Wooohoooooo!
With that publication out of the way, I was able to focus more time on my career. While I no longer use R on a daily basis and do not miss the hours of searching for that one pesky bug, I do analyze, critique, and use scientific literature everyday. Moreover, the critical thinking, creative, and collaborative skills I honed in the GEMM Lab, have been and will be useful for the rest of my life. Those hours of working through complicated statistical analyses and results in Leigh’s office pay off everyday. Reading outside of work, volunteering and working second jobs, all of this I learned from graduate school. Carrying this motivation, hard work, determination, and perseverance on past graduate school was undeniably what led me to where I am today. I have landed my dream job, working for NOAA Fisheries Sustainable Fisheries Division on salmon management and policy, in my dream location, the Pacific Northwest. My work now ties directly into ongoing management and policy that shapes our oceans, conservation efforts, and fisheries management. I am grateful for all the people who have supported me along the way, with this blog post focusing on the GEMM Lab and Leigh Torres as my advisor. I hope to be a mentor and guide for others along their path, as so many have helped me along mine. Good luck to any grad student reading this now! But more than luck, carry passion and determination forward because that is what will propel you onward on your own path. Thank you GEMM Lab, it is now time for me to enjoy my new job.
Above: Enjoying in my new home in the Pacific Northwest.
By Alexa Kownacki, Ph.D. Student, OSU Department of Fisheries and Wildlife, Geospatial Ecology of Marine Megafauna Lab
In what is the longest government shutdown in the history of the United States, many people are impacted. Speaking from a scientist’s point of view, I acknowledge the scientific community is one of many groups that is being majorly obstructed. Here at the GEMM Laboratory, all of us are feeling the frustrations of the federal government grinding to a halt in different ways. Although our research spans great distances—from Dawn’s work on New Zealand blue whales that utilizes environmental data managed by our federal government, to new projects that cannot get federal permit approvals to state data collection, to many of Leigh’s projects on the Oregon coast of the USA that are funded and collaborate with federal agencies—we all recognize that our science is affected by the shutdown. My research on common bottlenose dolphins is no exception; my academic funding is through the US Department of Defense, my collaborators are NOAA employees who contribute NOAA data; I use publicly-available data for additional variables that are government-maintained; and I am part of a federally-funded public university. Ironically, my previous blog post about the intersection of science and politics seems to have become even more relevant in the past few weeks.
Many graduate students like me are feeling the crunch as federal agencies close their doors and operations. Most people have seen the headlines that allude to such funding-related issues. However, it’s important to understand what the funding in question is actually doing. Whether we see it or not, the daily operations of the United States Federal government helps science progress on a multitude of levels.
Federal research in the United States is critical. Most governmental branches support research with the most well-known agencies for doing so being the National Science Foundation (NSF), the US Department of Agriculture (USDA), the National Oceanic and Atmospheric Administration (NOAA), and the National Aeronautics and Space Administration. There are 137 executive agencies in the USA (cei.org). On a finer scale, NSF alone receives approximately 40,000 scientific proposals each year (nsf.gov).
If I play a word association game and I am given the word “science”, my response would be “data”. Data—even absence data—informs science. The largest aggregate of metadata with open resources lives in the centralized website, data.gov, which is maintained by the federal government and is no longer accessible and directs you to this message:Here are a few more examples of science that has stopped in its track from lesser-known research entities operated by the federal government:
Currently, the National Weather Service (NWS) is unable to maintain or improve its advanced weather models. Therefore, in addition to those of us who include weather or climate aspects into our research, forecasters are having less and less information on which to base their weather predictions. Prior to the shutdown, scientists were changing the data format of the Global Forecast System (GFS)—the most advanced mathematical, computer-based weather modeling prediction system in the USA. Unfortunately, the GFS currently does not recognize much of the input data it is receiving. A model is only as good as its input data (as I am sure Dawn can tell you), and currently that means the GFS is very limited. Many NWS models are upgraded January-June to prepare for storm season later in the year. Therefore, there are long-term ramifications for the lack of weather research advancement in terms of global health and safety. (https://www.washingtonpost.com/weather/2019/01/07/national-weather-service-is-open-your-forecast-is-worse-because-shutdown/?noredirect=on&utm_term=.5d4c4c3c1f59)
An example of one output from the GFS model. (Source: weather.gov)
A map of the sampling sites that have been monitored since the 1980s for the Shenandoah Watershed Study and Virginia Trout Stream Sensitivity Study that cannot be accessed because of the shutdown. (Source: swas.evsc.virginia.edu)
NASA’s Stratospheric Observatory for Infrared Astronomy (SOFIA) flies over the snowy Sierra Nevada mountains while the telescope gathers information. (Source: NASA/ Jim Ross).
It is important to remember that science happens outside of laboratories and field sites; it happens at meetings and conferences where collaborations with other great minds brainstorm and discover the best solutions to challenging questions. The shutdown has stopped most federal travel. The annual American Meteorological Society Meeting and American Astronomical Society meeting were two of the scientific conferences in the USA that attract federal employees and took place during the shutdown. Conferences like these are crucial opportunities with lasting impacts on science. Think of all the impressive science that could have sparked at those meetings. Instead, many sessions were cancelled, and most major agencies had zero representation (https://spacenews.com/ams-2019-overview/). Topics like lidar data applications—which are used in geospatial research, such as what the GEMM Laboratory uses in some its projects, could not be discussed. The cascade effects of the shutdown prove that science is interconnected and without advancement, everyone’s research suffers.
It should be noted, that early-career scientists are thought to be the most negatively impacted by this shutdown because of financial instability and job security—as well as casting a dark cloud on their futures in science: largely unknown if they can support themselves, their families, and their research. (https://eos.org/articles/federal-government-shutdown-stings-scientists-and-science). Graduate students, young professors, and new professionals are all in feeling the pressure. Our lives are based on our research. When the funds that cover our basic research requirements and human needs do not come through as promised, we naturally become stressed.
An adult and a juvenile common bottlenose dolphin, forage along the San Diego coastline in November 2018. (Source: Alexa Kownacki)
So, yes, funding—or the lack thereof—is hurting many of us. Federally-funded individuals are selling possessions to pay for rent, research projects are at a standstill, and people are at greater health and safety risks. But, also, science, with the hope for bettering the world and answering questions and using higher thinking, is going backwards. Every day without progress puts us two days behind. At first glance, you may not think that my research on bottlenose dolphins is imperative to you or that the implications of the shutdown on this project are important. But, consider this: my study aims to quantify contaminants in common bottlenose dolphins that either live in nearshore or offshore waters. Furthermore, I study the short-term and long-term impacts of contaminants and other health markers on dolphin hormone levels. The nearshore common bottlenose dolphin stocks inhabit the highly-populated coastlines that many of us utilize for fishing and recreation. Dolphins are mammals, that respond to stress and environmental hazards, in similar ways to humans. So, those blubber hormone levels and contamination results, might be more connected to your health and livelihood than at first glance. The fact that I cannot download data from ERDDAP, reach my collaborators, or even access my data (that starts in the early 1980s), does impact you. Nearly everyone’s research is connected to each other’s at some level, and that, in turn has lasting impacts on all people—scientists or not. As the shutdown persists, I continue to question how to work through these research hurdles. If anything, it has been a learning experience that I hope will end soon for many reasons—one being: for science.
By Alexa Kownacki, Ph.D. Student, OSU Department of Fisheries and Wildlife, Geospatial Ecology of Marine Megafauna Lab
As much as I try to keep politics out of my science vocabulary, there are some ties between the two that cannot be severed. Often, science in the United States is very linked to the government because funding can be dependent on federal, state, and/or local government decisions. Therefore, it is part of our responsibility as scientists to be, at least, informed on governmental proceedings.
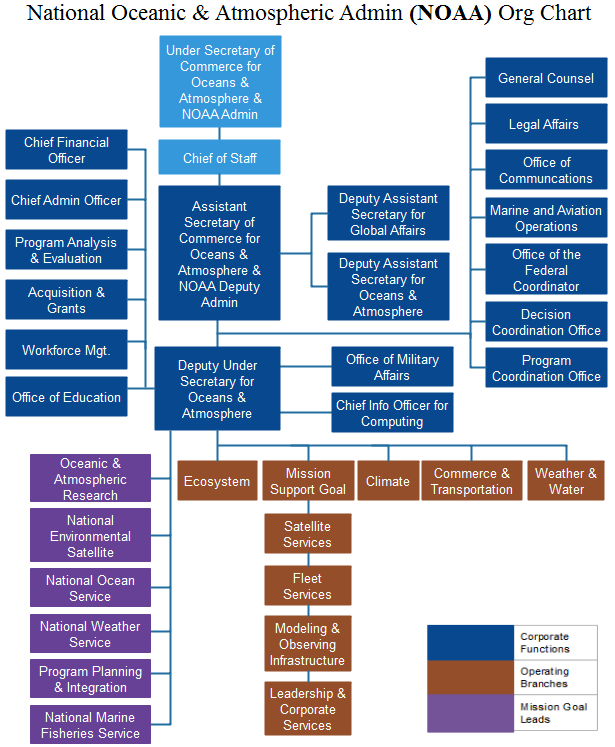
The United States has one agency that is particularly important to those of us conducting marine science: the National Oceanic and Atmospheric Administration (NOAA). NOAA’s mission is science, service, and stewardship with three major components:
To understand and predict changes in climate, weather, oceans and coasts
To share that knowledge and information with others
To conserve and manage coastal and marine ecosystems and resources
Organizational Chart of NOAA. (Image source: OrgCharting)
Last year, the U.S. Senate confirmed Retired Rear Admiral Timothy Gallaudet, Ph.D., as the Assistant Secretary of Commerce for Oceans and Atmosphere for the Department of Commerce in NOAA. This position is an appointment by the current President of the United States, and is tasked with overseeing the daily functions and the strategic and operational future of NOAA. NOAA oversees the National Marine Fisheries Service (NMFS), which is an agency responsible for the stewardship and management of the nation’s living marine resources. NMFS is a major player when it comes to marine science, particularly through the determination of priorities for research and management of marine species and habitats within the United States’ exclusive economic zone (EEZ).
In dark blue, the United States’ Exclusive Economic zones, surrounding land masses in green. (Figure by K. Laws)
Recently, I had the opportunity to hear Dr. Gallaudet speak to scientists who work for, or in conjunction with, a NMFS office. After the 16% budget cut from the fiscal year 2017 to 2018, many marine scientists are concerned about how budget changes will impact research. Therefore, I knew Dr. Gallaudet’s visit would provide insight about the future of marine science in the United States.
Dr. Gallaudet holds master’s and doctoral degrees in oceanography from Scripps Institution of Oceanography, as well as a bachelor’s degree from the United States Naval Academy. He spent 32 years in the Navy before stepping into his current role as Assistant Secretary. Throughout the meeting, Dr. Gallaudet emphasized his leadership motto: All in, All Good, and All for One.
Dr. Gallaudet also spoke about where he sees NOAA moving towards: the private sector.
A prominent conservation geneticist asked Dr. Gallaudet how NOAA can better foster advanced degree-seeking students. The geneticist commented that a decade ago there were 10-12 PhD students in this one science center alone. Today, there is “maybe one”. Dr. Gallaudet responded that the science centers should start reaching out to private industry. In response to other questions, he continued to redirect scientists toward United States-based corporations that could join forces with government agencies. He believes that if NMFS scientists share data and projects with local biotechnology, medical, and environmental companies, the country can foster positive relationships with industry. Dr. Gallaudet commented that the President wants to create these win-win situations: where the US government pairs with for-profit companies. It is up to us, as the scientists, how we make those connections.
As scientists, we frequently avoid heated political banter in the hopes of maintaining an objective and impartial approach to our research. However, these lines can be blurred. Much of our science depends on political decisions that mold our future, including how funding is allocated and what goals are prioritized. In 2010, Science Magazine published an online article, “Feeding your Research into the Policy Debate” where Elisabeth Pain highlighted the interdisciplinary nature of science and policy. In Pain’s interview with Troy Benn, a PhD student in Urban Ecology at the time, Benn comments that he learned just how much scientists play a role in policy and how research contributes to policy deliberations. Sometimes our research becomes of interest to politicians and sometimes it is the other way around.
From my experiences collaborating with government entities, private corporations, and nonprofit organizations, I realize that science-related policy is imperative. California established a non-profit, the California Ocean Science Trust (OST), for the specific objective supporting management decisions with the best science and bridging science and policy. A critical analysis of the OST by Pietri et al., “Using Science to Inform Controversial Issues: A Case Study from the California Ocean Science Trust”, matches legislation with science. For example, the Senate Bill (SB) 1319, better known as the California Ocean Protection Act (COPA), calls for “decisions informed by good science” and to “advance scientific understanding”. Science is explicitly written into legislation and I think that is a call to action. If an entire state can mobilize resources to create a team of interdisciplinary experts, I can inform myself on the politics that have potential to shape my future and the future of my science.
An image of the NOAA ship Bell M. Shimada transiting between stations. Multiple members of the GEMM Lab conducted surveys from this NOAA vessel in 2018. (Image source: Alexa Kownacki)
By Alexa Kownacki, Ph.D. Student, OSU Department of Fisheries and Wildlife, Geospatial Ecology of Marine Megafauna Lab
Did you know that Excel has a maximum number of rows? I do. During Winter Term for my GIS project, I was using Excel to merge oceanographic data, from a publicly-available data source website, and Excel continuously quit. Naturally, I assumed I had caused some sort of computer error. [As an aside, I’ve concluded that most problems related to technology are human error-based.] Therefore, I tried reformatting the data, restarting my computer, the program, etc. Nothing. Then, thanks to the magic of Google, I discovered that Excel allows no more than 1,048,576 rows by 16,384 columns. ONLY 1.05 million rows?! The oceanography data was more than 3 million rows—and that’s with me eliminating data points. This is what happens when we’re dealing with big data.
According to Merriam-Webster dictionary, big data is an accumulation of data that is too large and complex for processing by traditional database management tools (www.merriam-webster.com). However, there are journal articles, like this one from Forbes, that discuss the ongoing debate of how to define “big data”. According to the article, there are 12 major definitions; so, I’ll let you decide what you qualify as “big data”. Either way, I think that when Excel reaches its maximum row capacity, I’m working with big data.
Collecting oceanography data aboard the R/V Shimada. Photo source: Alexa K.
Here’s the thing: the oceanography data that I referred to was just a snippet of my data. Technically, it’s not even MY data; it’s data I accessed from NOAA’s ERDDAP website that had been consistently observed for the time frame of my dolphin data points. You may recall my blog about maps and geospatial analysis that highlights some of the reasons these variables, such as temperature and salinity, are important. However, what I didn’t previously mention was that I spent weeks working on editing this NOAA data. My project on common bottlenose dolphins overlays environmental variables to better understand dolphin population health off of California. These variables should have similar spatiotemporal attributes as the dolphin data I’m working with, which has a time series beginning in the 1980s. Without taking out a calculator, I still know that equates to a lot of data. Great data: data that will let me answer interesting, pertinent questions. But, big data nonetheless.
This is a screenshot of what the oceanography data looked like when I downloaded it to Excel. This format repeats for nearly 3 million rows.
Excel Screen Shot. Image source: Alexa K.
I showed this Excel spreadsheet to my GIS professor, and his response was something akin to “holy smokes”, with a few more expletives and a look of horror. It was not the sheer number of rows that shocked him; it was the data format. Nowadays, nearly everyone works with big data. It’s par for the course. However, the way data are formatted is the major split between what I’ll call “easy” data and “hard” data. The oceanography data could have been “easy” data. It could have had many variables listed in columns. Instead, this data alternated between rows with variable headings and columns with variable headings, for millions of cells. And, as described earlier, this is only one example of big data and its challenges.
Data does not always come in a form with text and numbers; sometimes it appears as media such as photographs, videos, and audio files. Big data just got a whole lot bigger. While working as a scientist at NOAA’s Southwest Fisheries Science Center, one project brought in over 80 terabytes of raw data per year. The project centered on the eastern north pacific gray whale population, and, more specifically, its migration. Scientists have observed the gray whale migration annually since 1994 from Piedras Blancas Light Station for the Northbound migration, and 2 out of every 5 years from Granite Canyon Field Station (GCFS) for the Southbound migration. One of my roles was to ground-truth software that would help transition from humans as observers to computer as observers. One avenue we assessed was to compare how well a computer “counted” whales compared to people. For this question, three infrared cameras at the GCFS recorded during the same time span that human observers were counting the migratory whales. Next, scientists, such as myself, would transfer those video files, upwards of 80 TB, from the hard drives to Synology boxes and to a different facility–miles away. Synology boxes store arrays of hard drives and that can be accessed remotely. To review, three locations with 80 TB of the same raw data. Once the data is saved in triplet, then I could run a computer program, to detect whale. In summary, three months of recorded infrared video files requires upwards of 240 TB before processing. This is big data.
Scientists on an observation shift at Granite Canyon Field Station in Northern California. Photo source: Alexa K.
Alexa and another NOAA scientist watching for gray whales at Piedras Blancas Light Station. Photo source: Alexa K.
In the GEMM Laboratory, we have so many sources of data that I did not bother trying to count. I’m entering my second year of the Ph.D. program and I already have a hard drive of data that I’ve backed up three different locations. It’s no longer a matter of “if” you work with big data, it’s “how”. How will you format the data? How will you store the data? How will you maintain back-ups of the data? How will you share this data with collaborators/funders/the public?
The wonderful aspect to big data is in the name: big and data. The scientific community can answer more, in-depth, challenging questions because of access to data and more of it. Data is often the limiting factor in what researchers can do because increased sample size allows more questions to be asked and greater confidence in results. That, and funding of course. It’s the reason why when you see GEMM Lab members in the field, we’re not only using drones to capture aerial images of whales, we’re taking fecal, biopsy, and phytoplankton samples. We’re recording the location, temperature, water conditions, wind conditions, cloud cover, date/time, water depth, and so much more. Because all of this data will help us and help other scientists answer critical questions. Thus, to my fellow scientists, I feel your pain and I applaud you, because I too know that the challenges that come with big data are worth it. And, to the non-scientists out there, hopefully this gives you some insight as to why we scientists ask for external hard drives as gifts.
Leila launching the drone to collect aerial images of gray whales to measure body condition. Photo source: Alexa K.
Using the theodolite to collect tracking data on the Pacific Coast Feeding Group in Port Orford, OR. Photo source: Alexa K.
By Alexa Kownacki, Ph.D. Student, OSU Department of Fisheries and Wildlife, Geospatial Ecology of Marine Megafauna Lab
Science—and fieldwork in particular—is known for its failures. There are websites, blogs, and Twitter pages dedicated to them. This is why, when things go according to plan, I rejoice. When they go even better than expected, I practically tear up from amazement. There is no perfect recipe for a great marine mammal and seabird research cruise, but I would suggest that one would look like this:
A Great Marine Mammal and Seabird Research Cruise Recipe:
A heavy pour of fantastic weather
Light on the wind and seas
Light on the glare
Equal parts amazing crew and good communication
A splash of positivity
A dash of luck
A pinch of delicious food
Heaps of marine mammal and seabird sightings
Heat to approximately 55-80 degrees F and transit for 10 days along transects at 10-12 knots
The end of another beautiful day at sea on the R/V Shimada. Image source: Alexa K.
The Northern California Current Ecosystem (NCCE) is a highly productive area that is home to a wide variety of cetacean species. Many cetaceans are indicator species of ecosystem health as they consume large quantities of prey from different levels in trophic webs and inhabit diverse areas—from deep-diving beaked whales to gray whales traveling thousands of miles along the eastern north Pacific Ocean. Because cetacean surveys are a predominant survey method in large bodies of water, they can be extremely costly. One alternative to dedicated cetacean surveys is using other research vessels as research platforms and effort becomes transect-based and opportunistic—with less flexibility to deviate from predetermined transects. This decreases expenses, creates collaborative research opportunities, and reduces interference in animal behavior as they are never pursued. Observing animals from large, motorized, research vessels (>100ft) at a steady, significant speed (>10kts/hour), provides a baseline for future, joint research efforts. The NCCE is regularly surveyed by government agencies and institutions on transects that have been repeated nearly every season for decades. This historical data provides critical context for environmental and oceanographic dynamics that impact large ecosystems with commercial and recreational implications.
My research cruise took place aboard the 208.5-foot R/V Bell M. Shimada in the first two weeks of May. The cruise was designated for monitoring the NCCE with the additional position of a marine mammal observer. The established guidelines did not allow for deviation from the predetermined transects. Therefore, mammals were surveyed along preset transects. The ship left port in San Francisco, CA and traveled as far north as Cape Meares, OR. The transects ranged from one nautical mile from shore and two hundred miles offshore. Observations occurred during “on effort” which was defined as when the ship was in transit and moving at a speed above 8 knots per hour dependent upon sea state and visibility. All observations took place on the flybridge during conducive weather conditions and in the bridge (one deck below the flybridge) when excessive precipitation was present. The starboard forward quarter: zero to ninety degrees was surveyed—based on the ship’s direction (with the bow at zero degrees). Both naked eye and 7×50 binoculars were used with at least 30 percent of time binoculars in use. To decrease observer fatigue, which could result in fewer detected sightings, the observer (me) rotated on a 40 minutes “on effort”, 20 minutes “off effort” cycle during long transits (>90 minutes).
Alexa on-effort using binoculars to estimate the distance and bearing of a marine mammal sighted off the starboard bow. Image source: Alexa K.
Data was collected using modifications to the SEEbird Wincruz computer program on a ruggedized laptop and a GPS unit was attached. At the beginning of each day and upon changes in conditions, the ship’s heading, weather conditions, visibility, cloud cover, swell height, swell direction, and Beaufort sea state (BSS) were recorded. Once the BSS or visibility was worse than a “5” (1 is “perfect” and 5 is “very poor”) observations ceased until there was improvement in weather. When a marine mammal was sighted the latitude and longitude were recorded with the exact time stamp. Then, I noted how the animal was sighted—either with binoculars or naked eye—and what action was originally noticed—blow, splash, bird, etc. The bearing and distance were noted using binoculars. The animal was given three generalized behavior categories: traveling, feeding, or milling. A sighting was defined as any marine mammal or group of animals. Therefore, a single sighting would have the species and the best, high, and low estimates for group size.
By my definitions, I had the research cruise of my dreams. There were moments when I imagined people joining this trip as a vacation. I *almost* felt guilty. Then, I remember that after watching water for almost 14 hours (thanks to the amazing weather conditions), I worked on data and reports and class work until midnight. That’s the part that no one talks about: the data. Fieldwork is about collecting data. It’s both what I live for and what makes me nervous. The amount of time, effort, and money that is poured into fieldwork is enormous. The acquisition of the data is not as simple as it seems. When I briefly described my position on this research cruise to friends, they interpret it to be something akin to whale-watching. To some extent, this is true. But largely, it’s grueling hours that leave you fatigued. The differences between fieldwork and what I’ll refer to as “everything else” AKA data analysis, proposal writing, manuscript writing, literature reviewing, lab work, and classwork, are the unbroken smile, the vaguely tanned skin, the hours of laughter, the sea spray, and the magical moments that reassure me that I’ve chosen the correct career path.
Alexa photographing a gray whale at sunset near Newport, OR. Image source: Alexa K.
This cruise was the second leg of the Northern California Current Ecosystem (NCCE) survey, I was the sole Marine Mammal and Seabird Observer—a coveted position. Every morning, I would wake up at 0530hrs, grab some breakfast, and climb to the highest deck: the fly-bridge. Akin to being on the top of the world, the fly-bridge has the best views for the widest span. From 0600hrs to 2000hrs I sat, stood, or danced in a one-meter by one-meter corner of the fly-bridge and surveyed. This visual is why people think I’m whale watching. In reality, I am constantly busy. Nonetheless, I had weather and seas that scientists dream about—and for 10 days! To contrast my luck, you can read Florence’s blog about her cruise. On these same transects, in February, Florence experienced 20-foot seas with heavy rain with very few marine mammal sightings—and of those, the only cetaceans she observed were gray whales close to shore. That starkly contrasts my 10 cetacean species with upwards of 45 sightings and my 20-minute hammock power naps on the fly-bridge under the warm sun.
Pacific white-sided dolphins traveling nearby. Image source: Alexa K.
Marine mammal sightings from this cruise included 10 cetacean species: Pacific white-sided dolphin, Dall’s porpoise, unidentified beaked whale, Cuvier’s beaked whale, gray whale, Minke whale, fin whale, Northern right whale dolphin, blue whale, humpback whale, and transient killer whale and one pinniped species: northern fur seal. What better way to illustrate these sightings than with a map? We are a geospatial lab after all.
Cetacean Sightings on the NCCE Cruise in May 2018. Image source: Alexa K.
This map is the result of data collection. However, it does not capture everything that was observed: sea state, weather, ocean conditions, bathymetry, nutrient levels, etc. There are many variables that can be added to maps–like this one (thanks to my GIS classes I can start adding layers!)–that can provide a better understanding of the ecosystem, predator-prey dynamics, animal behavior, and population health.
The catch from a bottom trawl at a station with some fish and a lot of pyrosomes (pink tube-like creatures). Image source: Alexa K.
Being a Ph.D. student can be physically and mentally demanding. So, when I was offered the opportunity to hone my data collection skills, I leapt for it. I’m happiest in the field: the wind in my face, the sunshine on my back, surrounded by cetaceans, and filled with the knowledge that I’m following my passion—and that this data is contributing to the greater scientific community.
Humpback whale photographed traveling southbound. Image source: Alexa K.


You must be logged in to post a comment.