There is something wonderful about time at sea, where your primary obligation is to observe the ocean from sunrise to sunset, day after day, scanning for signs of life. After hours of seemingly empty blue with only an occasional albatross gliding over the swells on broad wings, it is easy to question whether there is life in the expansive, blue, offshore desert. Splashes on the horizon catch your eye, and a group of dolphins rapidly approaches the ship in a flurry of activity. They play in the ship’s bow and wake, leaping out of the swells. Then, just as quickly as they came, they move on. Back to blue, for hours on end… until the next stirring on the horizon. A puff of exhaled air from a whale that first might seem like a whitecap or a smudge of sunscreen or salt spray on your sunglasses. It catches your eye again, and this time you see the dark body and distinctive dorsal fin of a humpback whale.
Figure 1. Pacific white-sided dolphins (Lagenorhynchus obliquidens) play in the big swell and surf the wake of the NOAA ship Bell M. Shimada off Coos Bay, Oregon. Photos: Dawn Barlow.
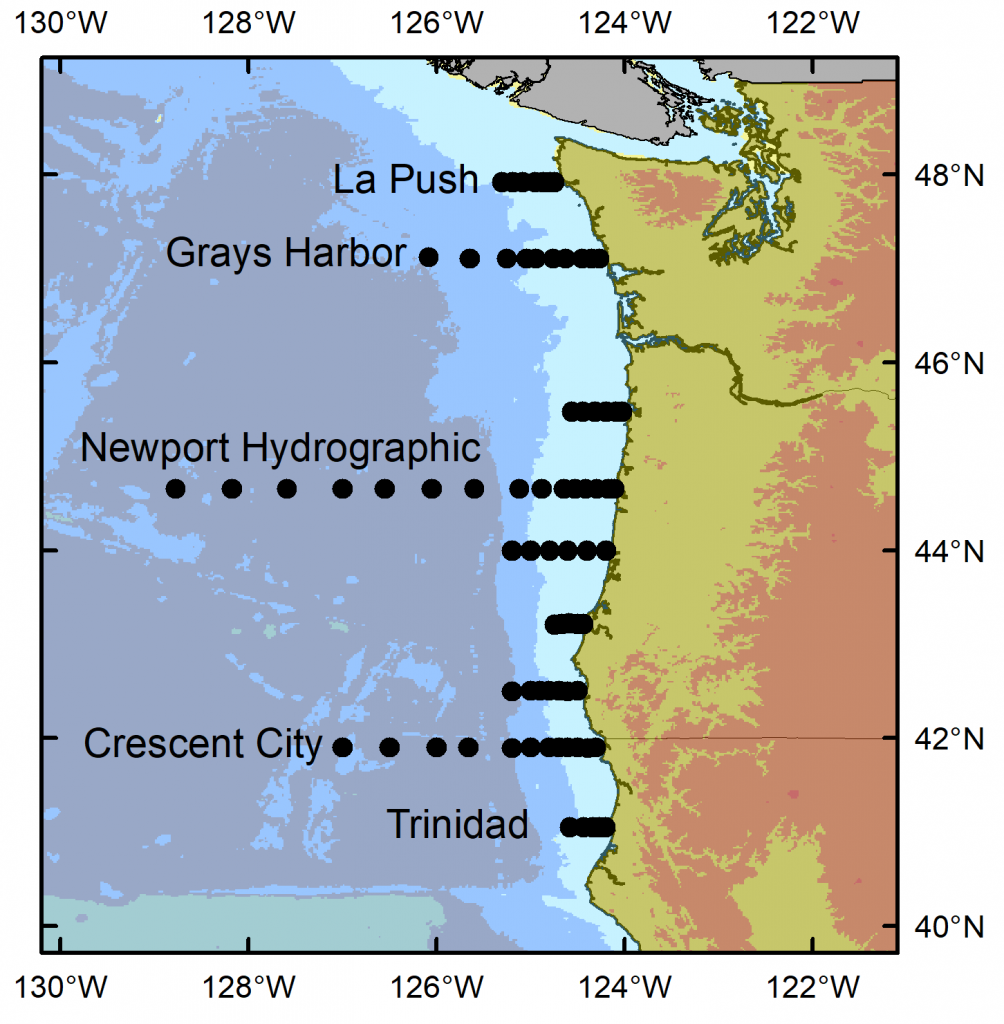
I have just returned from 10 days aboard the NOAA ship Bell M. Shimada, where I was the marine mammal observer on the Northern California Current (NCC) Cruise. These research cruises have sampled the NCC in the winter, spring, and fall for decades. As a result, a wealth of knowledge on the oceanography and plankton community in this dynamic ocean ecosystem has been assimilated by a dedicated team of scientists (find out more via the Newportal Blog). Members of the GEMM Lab have joined this research effort in the past two years, conducting marine mammal surveys during the transits between sampling stations (Fig. 2).
Figure 2. Northern California Current cruise sampling locations, where oceanography and plankton data are collected. Marine mammal surveys were conducted on the transits between stations.
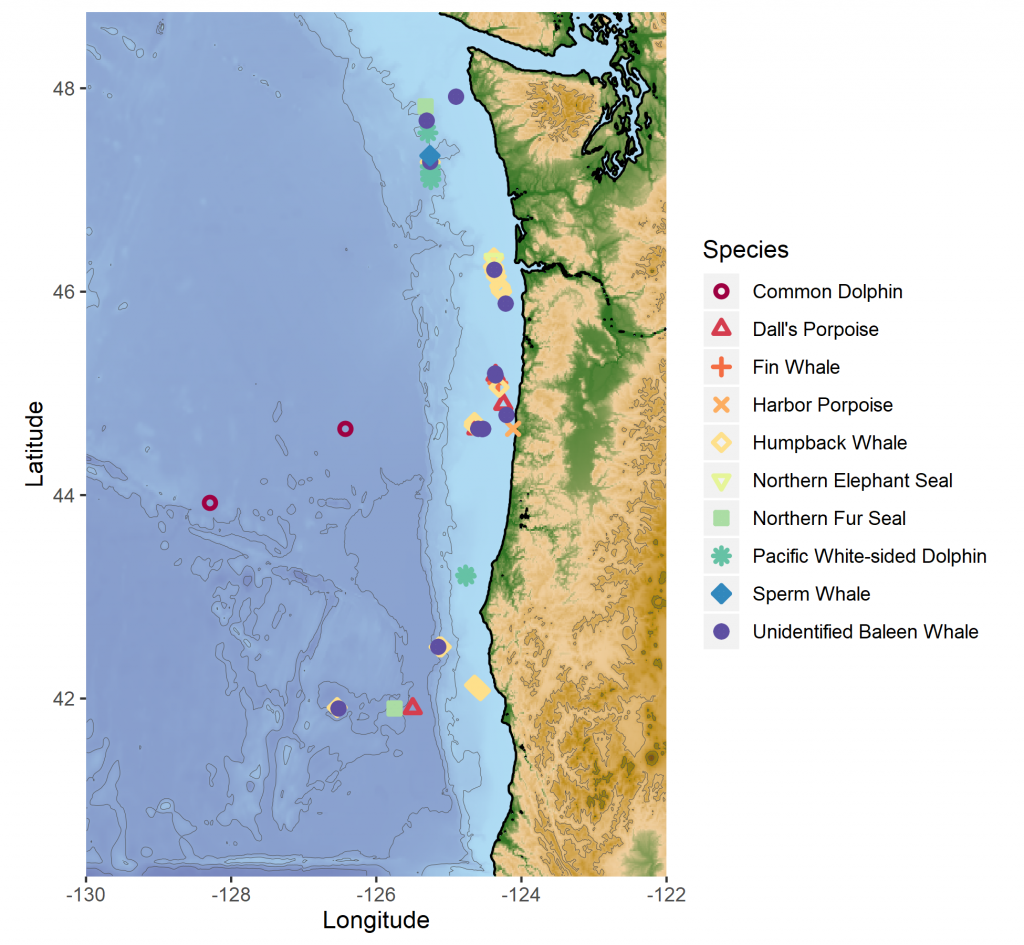
The fall 2019 NCC cruise was a resounding success. We were able to survey a large swath of the ecosystem between Crescent City, CA and La Push, WA, from inshore to 200 miles offshore. During that time, I observed nine different species of marine mammals (Table 1). As often as I use some version of the phrase “the marine environment is patchy and dynamic”, it never fails to sink in a little bit more every time I go to sea. On the map in Fig. 3, note how clustered the marine mammal sightings are. After nearly a full day of observing nothing but blue water, I would find myself scrambling to keep up with recording all the whales and dolphins we were suddenly in the midst of. What drives these clusters of sightings? What is it about the oceanography and prey community that makes any particular area a hotspot for marine mammals? We hope to get at these questions by utilizing the oceanographic data collected throughout the surveys to better understand environmental drivers of these distribution patterns.
Table 1. Summary of marine mammal
sightings from the September 2019 NCC Cruise.
Species
# sightings
Total # individuals
Northern Elephant Seal
1
1
Northern Fur Seal
2
2
Common Dolphin
2
8
Pacific White-sided Dolphin
8
143
Dall’s Porpoise
4
19
Harbor Porpoise
1
3
Sperm Whale
1
1
Fin Whale
1
1
Humpback Whale
22
36
Unidentified Baleen Whale
14
16
Figure 3. Map of marine mammal sighting locations from the September NCC cruise.
It was an auspicious time to survey the Northern California Current. Perhaps you have read recent news reports warning about the formation of another impending marine heatwave, much like the “warm blob” that plagued the North Pacific in 2015. We experienced it first-hand during the NCC cruise, with very warm surface waters off Newport extending out to 200 miles offshore (Fig. 4). A lot of energy input from strong winds would be required to mix that thick, warm layer and allow cool, nutrient-rich water to upwell along the coast. But it is already late September, and as the season shifts from summer to fall we are at the end of our typical upwelling season, and the north winds that would typically drive that mixing are less likely. Time will tell what is in store for the NCC ecosystem as we face the onset of another marine heatwave.
Figure 4. Temperature contours over the upper 150 m from 1-200 miles off Newport, Oregon from Fall 2014-2019. During Fall 2014, the Warm Blob inundated the Oregon shelf. Surface temperatures during that survey were 17°- 18°C along the entire transect. During 2015 and 2016 the warm water (16°C) layer had deepened and occupied the upper 50 m. During 2018, the temperature was 16°C in the upper 20 m and cooler on the shelf, indicative of residual upwelling. During this survey in 2019, we again saw very warm (18°C) temperatures in the upper water column over the entire transect. Image and caption credit: Jennifer Fisher.
It was a joy to spend 10 days at sea with this team of scientists. Insight, collaboration, and innovation are born from interdisciplinary efforts like the NCC cruises. Beyond science, what a privilege it is to be on the ocean with a group of people you can work with and laugh with, from the dock to 200 miles offshore, south to north and back again.
Dawn Barlow on the flying bridge of NOAA Ship Bell M. Shimada, heading out to sea with the Newport bridge in the background. Photo: Anna Bolm.
By Dominique Kone, Masters Student in Marine Resource Management
I recently attended and presented at the 11th biennial Sea Otter Conservation Workshop (the Workshop), hosted by the Seattle Aquarium. As the largest sea otter-focused meeting in the world, the Workshop brought together dozens of scientists, managers, and conservationists to share important information and research on sea otter conservation issues. Being new to this community, this was my first time attending the Workshop, and I had the privilege of meeting some of the most influential sea otter experts in the world. Here, I recount some of my highlights from the Workshop and discuss the importance of this meeting to the continued conservation and management of global sea otter populations.
Source: The Seattle Aquarium.
Sea otters represent one of the most successful species recovery stories in history. After facing near extinction at the close of the Maritime Fur Trade in 1911 (Kenyon 1969), they have made an impressive comeback due to intense conservation efforts. The species is no longer in such dire conditions, but some distinct populations are still considered at-risk due to their small numbers and persistent threats, such as oil spills or disease. We still have a ways to go until global sea otter populations are recovered, and collaboration across disciplines is needed for continued progress.
The Workshop provided the perfect means for this collaboration and sharing of information. Attendees were a mixture of scientists, managers, advocacy groups, zoos and aquarium staff, and graduate students. Presentations spanned a range of disciplines, including ecology, physiology, genetics, and animal husbandry, to name a few. On the first day of the Workshop, most presentations focused on sea otter ecology and management. The plenary speaker – Dr. Jim Estes (retired ecologist and University of California, Santa Cruz professor) – noted that one of the reasons we’ve had such success in sea otter recovery is due to our vast knowledge of their natural history and behavior. Much of this progress can be attributed to seminal work, such as Keyon’s 1969 report, which provides an extensive synthesis of several sea otter ecological and behavioral studies (Kenyon 1969). Beginning in the 1970’s, several other ecologists – such as David Duggins, Jim Bodkin, Tim Tinker, and Jim himself – expanded this understanding to complex trophic cascades, individual diet specialization, and population demographics.
Jim Estes and Tim Tinker. Source: Jim Estes.
These ecological studies have played an integral role in sea otter conservation, but other disciplines were and continue to be just as important. As the Workshop continued into the second and third days, presentations shifted their focus to physiology, veterinary medicine, and animal husbandry. Two of these speakers – who have played pivotal roles in these areas – are Dr. Melissa Miller (veterinarian specialist and pathologist with the California Department of Fish & Wildlife) and Dr. Mike Murray (director of veterinary services at the Monterey Bay Aquarium). Dr. Miller presented her years of work on understanding causes of mortality in wild southern sea otters in California. Her research showed that shark predation is a large source of mortality in the southern stock, but cardiac arrest, which has gained less attention, is also a large contributing factor.
Dr. Murray discussed his practice of caring for and studying the biology of captive sea otters. He provided an overview of some of the routine procedures (i.e. full body exams, oral surgeries, and radio transmitter implantation) his team conducts to assess and treat stranded wild otters, so they can be returned to the wild. Both presenters demonstrated how advances in veterinary medicine have helped us better understand the multitude of threats to sea otters in the wild, and what interventive measures can be taken to recover sick or injured otters so they can contribute to wild population recovery. By understanding how these threats are impacting sea otter health on an individual level, we can be better equipped to prevent population-wide consequences.
Dr. Melissa Miller conducting a sea otter necropsy. Source: California Department of Fish & Game.
Throughout the entire Workshop, experts with decades of experience presented their work. Yet, one of the most encouraging aspects of this meeting was that several graduate students also presented their research, including myself. In a way, listening to presenters both early and late in their careers gave us a glimpse into the past and future of sea otter conservation. Much of the work currently being conducted by graduate students addresses some of the most pressing and emerging issues (e.g. shark predation, plastic pollution, and diseases) in this field, but also builds off the great knowledge base acquired by many of those at the Workshop.
Perhaps even more encouraging was the level of collaboration and mentorship between graduate students and seasoned experts. Included in almost every graduate student’s acknowledgement section of their presentations, were the names of several Workshop attendees who either advised them or provided guidance on their research. These presentations were often followed up with further meetings between students and their mentors. These types of interactions really demonstrated how invested the sea otter community is in fostering the next generation of leaders in this field. This “passing of the mantel” is imperative to maintain knowledge between generations and to continue to make progress in sea otter conservation. As a graduate student, I greatly appreciated getting the opportunity to interact with and gain advice from many of these researchers, whom I’ve only read about in articles.
Source: Bay Nature.
To summarize my experience, it became clear how important this Workshop was to the broader sea otter conservation community. The Workshop provided the perfect venue for collaboration amongst experts, as well as mentorship of upcoming leaders in the field. It’s important to recognize the great progress and strides the community has made already in understanding the complex lives of sea otters. Sea otters have not recovered everywhere. Therefore, we need to continue to acquire knowledge across all disciplines if we are to make progress in the future, especially as new threats and issues emerge. It will take a village.
Literature Cited:
Kenyon, K. W. 1969. The sea otter in the eastern Pacific Ocean. North American Fauna. 68. 352pp.
As you may have read in previous blog posts, my research focuses on the ecology of blue whales in New Zealand. Through my MS research and years of work by a dedicated team, we were able to document and describe a population of around 700 blue whales that are unique to New Zealand, present year-round, and genetically distinct from all other known populations [1]. While this is a very exciting discovery, documenting this population has also unlocked a myriad of further questions about these whales. Can we predict when and where the whales are most likely to be? How does their distribution change seasonally? How often do they overlap with anthropogenic activity? My PhD research will aim to answer these questions through models of blue whale distribution patterns relative to their environment at multiple spatial and temporal scales.
Because time at sea for vessel-based surveys is cost-limited and difficult to come by, it is in any scientist’s best interest to collect as many concurrent streams of data as possible while in the field. When Dr. Leigh Torres designed our blue whale surveys that were conducted in 2014, 2016, and 2017, she really did a miraculous job of maximizing time on the water. With more data, more questions can be asked. These complimentary datasets have led to the pursuit of many “side projects”. I am lucky enough to work on these questions in parallel with what will form the bulk of my PhD, and collaborate with a number of people in the process. In this blog post, I’ll give you some short teasers of these “side projects”!
Surface lunge feeding as a foraging strategy for New Zealand blue whales
Most of what we know about blue whale foraging behavior comes from studies conducted off the coast of Southern California[2,3] using suction cup accelerometer tags. While these studies in the California Current ecosystem have led to insights and breakthroughs in our understanding of these elusive marine predators and their prey, they have also led us to adopt the paradigm that krill patches are denser at depth, and blue whales are most likely to target these deep prey patches when they feed. We have combined our prey data with blue whale behavioral data observed via a drone to investigate blue whale foraging in New Zealand, with a particular emphasis on surface feeding as a strategy. In our recent analyses, we are finding that in New Zealand, lunge feeding at the surface may be more than just “snacking”. Rather, it may be an energetically efficient strategy that blue whales have evolved in the region with unique implications for conservation.
Figure 1. A blue whale lunges on an aggregation of krill. UAS piloted by Todd Chandler.
Combining multiple data streams for a comprehensive health assessment
In the field, we collected photographs, blubber biopsy samples, fecal samples, and conducted unmanned aerial system (UAS, a.k.a. “drone”) flights over blue whales. The blubber and fecal samples can be analyzed for stress and reproductive hormone levels; UAS imagery allows us to quantify a whale’s body condition[4]; and photographs can be used to evaluate skin condition for abnormalities. By pulling together these multiple data streams, this project aims to establish a baseline understanding of the variability in stress and reproductive hormone levels, body condition, and skin condition for the population. Because our study period spans multiple years, we also have the ability to look at temporal patterns and individual changes over time. From our preliminary results, we have evidence for multiple pregnant females from elevated pregnancy and stress hormones, as well as apparent pregnancy from the body condition analysis. Additionally, a large proportion of the population appear to be affected by blistering and cookie cutter shark bites.
Figure 2. An example aerial drone image of a blue whale that will be used to asses body condition, i.e. how healthy or malnourished the whale is. (Drone piloted by Todd Chandler).
Figure 3. Images of blue whale skin condition, affected by A) blistering and B) cookie cutter shark bites.
Comparing body shape and morphology between species
The GEMM Lab uses UAS to quantitatively study behavior[5] and health of large whales. From various projects in different parts of the world we have now assimilated UAS data on blue, gray, and humpback whales. We will measure these images to investigate differences in body shape and morphology among these species. We plan to explore how form follows function across baleen whales, based on their different life histories, foraging strategies, and ecological roles.
Figure 4 . Aerial images of A) a blue whale in New Zealand’s South Taranaki Bight, B) a gray whale off the coast of Oregon, and C) a humpback whale off the coast of Washington. Drone piloted by Todd Chandler (A and B) and Jason Miranda (C).
So it goes—my dissertation will contain a series of chapters that build on one another to explore blue whale distribution patterns at increasing scales, as well as a growing number of appendices for these “side projects”. Explorations and collaborations like I’ve described here allow me to broaden my perspectives and diversify my analytical skills, as well as work with many excellent teams of scientists. The more data we collect, the more questions we are able to ask. The more questions we ask, the more we seem to uncover that is yet to be understood. So stay tuned for some exciting forthcoming results from all of these analyses, as well as plenty of new questions, waiting to be posed.
References
Barlow DR et al. 2018 Documentation of a New Zealand blue whale population based on multiple lines of evidence. Endanger. Species Res.36, 27–40. (doi:https://doi.org/10.3354/esr00891)
Hazen EL, Friedlaender AS, Goldbogen JA. 2015 Blue whales (Balaenoptera musculus) optimize foraging efficiency by balancing oxygen use and energy gain as a function of prey density. Sci. Adv.1, e1500469–e1500469. (doi:10.1126/sciadv.1500469)
Goldbogen JA, Calambokidis J, Oleson E, Potvin J, Pyenson ND, Schorr G, Shadwick RE. 2011 Mechanics, hydrodynamics and energetics of blue whale lunge feeding: efficiency dependence on krill density. J. Exp. Biol.214, 131–146. (doi:10.1242/jeb.048157)
Burnett JD, Lemos L, Barlow DR, Wing MG, Chandler TE, Torres LG. 2018 Estimating morphometric attributes on baleen whales using small UAS photogrammetry: A case study with blue and gray whales. Mar. Mammal Sci. (doi:10.1111/mms.12527)
Torres LG, Nieukirk SL, Lemos L, Chandler TE. 2018 Drone Up! Quantifying Whale Behavior From a New Perspective Improves Observational Capacity. Front. Mar. Sci.5. (doi:10.3389/fmars.2018.00319)
By Alexa Kownacki, Ph.D. Student, OSU Department of Fisheries and Wildlife, Geospatial Ecology of Marine Megafauna Lab
Data wrangling, in my own loose definition, is the necessary combination of both data selection and data collection. Wrangling your data requires accessing then assessing your data. Data collection is just what it sounds like: gathering all data points necessary for your project. Data selection is the process of cleaning and trimming data for final analyses; it is a whole new bag of worms that requires decision-making and critical thinking. During this process of data wrangling, I discovered there are two major avenues to obtain data: 1) you collect it, which frequently requires an exorbitant amount of time in the field, in the lab, and/or behind a computer, or 2) other people have already collected it, and through collaboration you put it to a good use (often a different use then its initial intent). The latter approach may result in the collection of so much data that you must decide which data should be included to answer your hypotheses. This process of data wrangling is the hurdle I am facing at this moment. I feel like I am a data detective.
Data wrangling illustrated by members of the R-programming community. (Image source: R-bloggers.com)
My project focuses on assessing the health conditions of the two ecotypes of bottlenose dolphins between the waters off of Ensenada, Baja California, Mexico to San Francisco, California, USA between 1981-2015. During the government shutdown, much of my data was inaccessible, seeing as it was in possession of my collaborators at federal agencies. However, now that the shutdown is over, my data is flowing in, and my questions are piling up. I can now begin to look at where these animals have been sighted over the past decades, which ecotypes have higher contaminant levels in their blubber, which animals have higher stress levels and if these are related to geospatial location, where animals are more susceptible to human disturbance, if sex plays a role in stress or contaminant load levels, which environmental variables influence stress levels and contaminant levels, and more!
Alexa, alongside collaborators, photographing transiting bottlenose dolphins along the coastline near Santa Barbara, CA in 2015 as part of the data collection process. (Image source: Nick Kellar).
Over the last two weeks, I was emailed three separate Excel spreadsheets representing three datasets, that contain partially overlapping data. If Microsoft Access is foreign to you, I would compare this dilemma to a very confusing exam question of “matching the word with the definition”, except with the words being in different languages from the definitions. If you have used Microsoft Access databases, you probably know the system of querying and matching data in different databases. Well, imagine trying to do this with Excel spreadsheets because the databases are not linked. Now you can see why I need to take a data management course and start using platforms other than Excel to manage my data.
A visual interpretation of trying to combine datasets being like matching the English definition to the Spanish translation. (Image source: Enchanted Learning)
In the first dataset, there are 6,136 sightings of Common bottlenose dolphins (Tursiops truncatus) documented in my study area. Some years have no sightings, some years have fewer than 100 sightings, and other years have over 500 sightings. In another dataset, there are 398 bottlenose dolphin biopsy samples collected between the years of 1992-2016 in a genetics database that can provide the sex of the animal. The final dataset contains records of 774 bottlenose dolphin biopsy samples collected between 1993-2018 that could be tested for hormone and/or contaminant levels. Some of these samples have identification numbers that can be matched to the other dataset. Within these cross-reference matches there are conflicting data in terms of amount of tissue remaining for analyses. Sorting these conflicts out will involve more digging from my end and additional communication with collaborators: data wrangling at its best. Circling back to what I mentioned in the beginning of this post, this data was collected by other people over decades and the collection methods were not standardized for my project. I benefit from years of data collection by other scientists and I am grateful for all of their hard work. However, now my hard work begins.
The cutest part of data wrangling: finding adorable images of bottlenose dolphins, photographed during a coastal survey. (Image source: Alexa Kownacki).
There is also a large amount of data that I downloaded from federally-maintained websites. For example, dolphin sighting data from research cruises are available for public access from the OBIS (Ocean Biogeographic Information System) Sea Map website. It boasts 5,927,551 records from 1,096 data sets containing information on 711 species with the help of 410 collaborators. This website is incredible as it allows you to search through different data criteria and then download the data in a variety of formats and contains an interactive map of the data. You can explore this at your leisure, but I want to point out the sheer amount of data. In my case, the OBIS Sea Map website is only one major platform that contains many sources of data that has already been collected, not specifically for me or my project, but will be utilized. As a follow-up to using data collected by other scientists, it is critical to give credit where credit is due. One of the benefits of using this website, is there is information about how to properly credit the collaborators when downloading data. See below for an example:
Example citation for a dataset (Dataset ID: 1201):
Lockhart, G.G., DiGiovanni Jr., R.A., DePerte, A.M. 2014. Virginia and Maryland Sea Turtle Research and Conservation Initiative Aerial Survey Sightings, May 2011 through July 2013. Downloaded from OBIS-SEAMAP (http://seamap.env.duke.edu/dataset/1201) on xxxx-xx-xx.
Another federally-maintained data source that boasts more data than I can quantify is the well-known ERDDAP website. After a few Google searches, I finally discovered that the acronym stands for Environmental Research Division’s Data Access Program. Essentially, this the holy grail of environmental data for marine scientists. I have downloaded so much data from this website that Excel cannot open the csv files. Here is yet another reason why young scientists, like myself, need to transition out of using Excel and into data management systems that are developed to handle large-scale datasets. Everything from daily sea surface temperatures collected on every, one-degree of latitude and longitude line from 1981-2015 over my entire study site to Ekman transport levels taken every six hours on every longitudinal degree line over my study area. I will add some environmental variables in species distribution models to see which account for the largest amount of variability in my data. The next step in data selection begins with statistics. It is important to find if there are highly correlated environmental factors prior to modeling data. Learn more about fitting cetacean data to models here.
The ERDAPP website combined all of the average Sea Surface Temperatures collected daily from 1981-2018 over my study site into a graphical display of monthly composites. (Image Source: ERDDAP)
As you can imagine, this amount of data from many sources and collaborators is equal parts daunting and exhilarating. Before I even begin the process of determining the spatial and temporal spread of dolphin sightings data, I have to identify which data points have sex identified from either hormone levels or genetics, which data points have contaminants levels already quantified, which samples still have tissue available for additional testing, and so on. Once I have cleaned up the datasets, I will import the data into the R programming package. Then I can visualize my data in plots, charts, and graphs; this will help me identify outliers and potential challenges with my data, and, hopefully, start to see answers to my focal questions. Only then, can I dive into the deep and exciting waters of species distribution modeling and more advanced statistical analyses. This is data wrangling and I am the data detective.
What people may think a ‘data detective’ looks like, when, in reality, it is a person sitting at a computer. (Image source: Elder Research)
Like the well-known phrase, “With great power comes great responsibility”, I believe that with great data, comes great responsibility, because data is power. It is up to me as the scientist to decide which data is most powerful at answering my questions.
Data is information. Information is knowledge. Knowledge is power. (Image source: thedatachick.com)
By Rachael Orben, Assistant Professor (Senior Research), Seabird Oceanography Lab
This February I had the opportunity to spend two weeks at Midway Atoll National Wildlife Refuge in the Papahānaumokuākea Marine National Monument. I was there to GPS track black-footed and Laysan albatross during their short chick-brooding foraging trips. Two weeks is just enough time since the albatross are taking short trips (3-5 days) to feed their rapidly growing chicks.
My first visit to Midway (2016 blog post) occurred right as the black-footed albatross chicks were hatching (quickly followed by the Laysan albatross chicks). This time, we arrived almost exactly when I had left off. The oldest chicks were just about two weeks old. This shift in phenology meant that, though subtle, each day offered new insights for me as I watched chicks transform into large aware and semi-mobile birds. By the time we left, unattended chicks were rapidly multiplying as the adults shifted to the chick-rearing stage. During chick rearing, both parents leave the chick unattended and take longer foraging trips.
Our research goal was to collect tracking data from both species that can be used to address a couple of research questions. First of all, winds can aid, or hinder albatross foraging and flight efficiency (particularly during the short brooding trips). In the North Pacific, the strength and direction of the winds are influenced by the ENSO (El Niño Southern Oscillation) cycles. The day after we left Midway, NOAA issued an El Niño advisory indicating weak El Nino conditions. We know from previous work at Tern Island (farther east and farther south at 23.87 N, -166.28 W) that El Niño improves foraging for Laysan albatrosses during chick brooding, while during La Niña reproductive success is lower (Thorne et al., 2016). However, since Midway is farther north, and farther west the scenario might be different there. Multiple years of GPS tracking data are needed to address this question and we hope to return to collect more data next year (especially if La Niña follows the El Niño as is often the case).
We will also overlap the tracking data with fishing boat locations from the Global Fishing Watch database to assess the potential for birds from Midway to interact with high seas fisheries during this time of year (project description, associated blog post). Finally, many of the tags we deployed incorporated a barometric pressure sensor and the data can be used to estimate flight heights relative to environmental conditions such as wind strength. This type of data is key to assessing the impact of offshore wind energy (Kelsey et al., 2018).
How to track an albatross
To track an albatross we use small GPS tags that we tape to the back feathers. After the bird returns from a foraging trip, we remove the tape from the feathers and take the datalogger off. Then we recharge the battery and download the data!
Catching a tagged albatross that just returned from its foraging trip. Photo V. Ternisien
Recording data. Photo V. Ternisien
Getting ready to remove the GPS datalogger. Photo V. Ternisien
The GPS datalogger was taped to the back feathers of the bird. To remove the tag we simply peel off the tape. Photo V. Ternisien
My previous visit to Midway occurred just after house mice were discovered attacking incubating adult albatrosses. Since then, a lot of thought and effort had gone into developing a plan to eradicate mice from Midway. You can find out more via Island Conservation’s Midway blogs and the USFWS.
Dancing.
There is always something happening in a seabird colony.
Red-tailed tropicbird
From left to right: A Laysan albatross, a hybrid, and a black-footed albatross.
The colony was never quiet. Even at night.
A GPS tagged Laysan albatross.
Habitat restoration.
A short-tailed albatross sitting next to his chick (the large black chick the his right).
References
Kelsey, E. C., Felis, J. J., Czapanskiy, M., Pereksta, D. M., & Adams, J. (2018). Collision and displacement vulnerability to offshore wind energy infrastructure among marine birds of the Pacific Outer Continental Shelf. Journal of Environmental Management, 227, 229–247. http://doi.org/10.1016/j.jenvman.2018.08.051
Thorne, L. H., Conners, M. G., Hazen, E. L., Bograd, S. J., Antolos, M., Costa, D. P., & Shaffer, S. A. (2016). Effects of El Niño-driven changes in wind patterns on North Pacific albatrosses. Journal of the Royal Society Interface, 13(119), 20160196. http://doi.org/10.1098/rsif.2016.0196
By Alexa Kownacki, Ph.D. Student, OSU Department of Fisheries and Wildlife, Geospatial Ecology of Marine Megafauna Lab
In what is the longest government shutdown in the history of the United States, many people are impacted. Speaking from a scientist’s point of view, I acknowledge the scientific community is one of many groups that is being majorly obstructed. Here at the GEMM Laboratory, all of us are feeling the frustrations of the federal government grinding to a halt in different ways. Although our research spans great distances—from Dawn’s work on New Zealand blue whales that utilizes environmental data managed by our federal government, to new projects that cannot get federal permit approvals to state data collection, to many of Leigh’s projects on the Oregon coast of the USA that are funded and collaborate with federal agencies—we all recognize that our science is affected by the shutdown. My research on common bottlenose dolphins is no exception; my academic funding is through the US Department of Defense, my collaborators are NOAA employees who contribute NOAA data; I use publicly-available data for additional variables that are government-maintained; and I am part of a federally-funded public university. Ironically, my previous blog post about the intersection of science and politics seems to have become even more relevant in the past few weeks.
Many graduate students like me are feeling the crunch as federal agencies close their doors and operations. Most people have seen the headlines that allude to such funding-related issues. However, it’s important to understand what the funding in question is actually doing. Whether we see it or not, the daily operations of the United States Federal government helps science progress on a multitude of levels.
Federal research in the United States is critical. Most governmental branches support research with the most well-known agencies for doing so being the National Science Foundation (NSF), the US Department of Agriculture (USDA), the National Oceanic and Atmospheric Administration (NOAA), and the National Aeronautics and Space Administration. There are 137 executive agencies in the USA (cei.org). On a finer scale, NSF alone receives approximately 40,000 scientific proposals each year (nsf.gov).
If I play a word association game and I am given the word “science”, my response would be “data”. Data—even absence data—informs science. The largest aggregate of metadata with open resources lives in the centralized website, data.gov, which is maintained by the federal government and is no longer accessible and directs you to this message:Here are a few more examples of science that has stopped in its track from lesser-known research entities operated by the federal government:
Currently, the National Weather Service (NWS) is unable to maintain or improve its advanced weather models. Therefore, in addition to those of us who include weather or climate aspects into our research, forecasters are having less and less information on which to base their weather predictions. Prior to the shutdown, scientists were changing the data format of the Global Forecast System (GFS)—the most advanced mathematical, computer-based weather modeling prediction system in the USA. Unfortunately, the GFS currently does not recognize much of the input data it is receiving. A model is only as good as its input data (as I am sure Dawn can tell you), and currently that means the GFS is very limited. Many NWS models are upgraded January-June to prepare for storm season later in the year. Therefore, there are long-term ramifications for the lack of weather research advancement in terms of global health and safety. (https://www.washingtonpost.com/weather/2019/01/07/national-weather-service-is-open-your-forecast-is-worse-because-shutdown/?noredirect=on&utm_term=.5d4c4c3c1f59)
An example of one output from the GFS model. (Source: weather.gov)
A map of the sampling sites that have been monitored since the 1980s for the Shenandoah Watershed Study and Virginia Trout Stream Sensitivity Study that cannot be accessed because of the shutdown. (Source: swas.evsc.virginia.edu)
NASA’s Stratospheric Observatory for Infrared Astronomy (SOFIA) flies over the snowy Sierra Nevada mountains while the telescope gathers information. (Source: NASA/ Jim Ross).
It is important to remember that science happens outside of laboratories and field sites; it happens at meetings and conferences where collaborations with other great minds brainstorm and discover the best solutions to challenging questions. The shutdown has stopped most federal travel. The annual American Meteorological Society Meeting and American Astronomical Society meeting were two of the scientific conferences in the USA that attract federal employees and took place during the shutdown. Conferences like these are crucial opportunities with lasting impacts on science. Think of all the impressive science that could have sparked at those meetings. Instead, many sessions were cancelled, and most major agencies had zero representation (https://spacenews.com/ams-2019-overview/). Topics like lidar data applications—which are used in geospatial research, such as what the GEMM Laboratory uses in some its projects, could not be discussed. The cascade effects of the shutdown prove that science is interconnected and without advancement, everyone’s research suffers.
It should be noted, that early-career scientists are thought to be the most negatively impacted by this shutdown because of financial instability and job security—as well as casting a dark cloud on their futures in science: largely unknown if they can support themselves, their families, and their research. (https://eos.org/articles/federal-government-shutdown-stings-scientists-and-science). Graduate students, young professors, and new professionals are all in feeling the pressure. Our lives are based on our research. When the funds that cover our basic research requirements and human needs do not come through as promised, we naturally become stressed.
An adult and a juvenile common bottlenose dolphin, forage along the San Diego coastline in November 2018. (Source: Alexa Kownacki)
So, yes, funding—or the lack thereof—is hurting many of us. Federally-funded individuals are selling possessions to pay for rent, research projects are at a standstill, and people are at greater health and safety risks. But, also, science, with the hope for bettering the world and answering questions and using higher thinking, is going backwards. Every day without progress puts us two days behind. At first glance, you may not think that my research on bottlenose dolphins is imperative to you or that the implications of the shutdown on this project are important. But, consider this: my study aims to quantify contaminants in common bottlenose dolphins that either live in nearshore or offshore waters. Furthermore, I study the short-term and long-term impacts of contaminants and other health markers on dolphin hormone levels. The nearshore common bottlenose dolphin stocks inhabit the highly-populated coastlines that many of us utilize for fishing and recreation. Dolphins are mammals, that respond to stress and environmental hazards, in similar ways to humans. So, those blubber hormone levels and contamination results, might be more connected to your health and livelihood than at first glance. The fact that I cannot download data from ERDDAP, reach my collaborators, or even access my data (that starts in the early 1980s), does impact you. Nearly everyone’s research is connected to each other’s at some level, and that, in turn has lasting impacts on all people—scientists or not. As the shutdown persists, I continue to question how to work through these research hurdles. If anything, it has been a learning experience that I hope will end soon for many reasons—one being: for science.
By Dominique Kone, Masters Student, Marine Resource Management
As the human population continues to grow, so does our impact on marine environments. In many cases, these problems – such as microplastics, vessel noise, or depleted fisheries – are far too grand for any one person to tackle on their own and it takes a team effort to find adequate solutions. Experts within a single field (e.g. ecology, economics, genetics) have been collaborating to tackle these issues for decades, but there is an increasing interest and recognition of the importance in working with others outside one’s own discipline.
It’s not surprising that most collaborative efforts are between experts from the same field. It’s easier to converse with those with similar vocabulary, we often enjoy learning from our peers, and our thought-processes and problem-solving skills are typically very similar. However, as issues become more complex and stretch across disciplines, the need for interdisciplinary collaboration becomes more and more imperative. As a graduate student studying marine resource management, I’ve learned the great value in conducting interdisciplinary work. Yet, I still have much to learn if I want to continue to help find solutions to the many complex marine issues. Therefore, over the next year, I’ve committed to joining a interdisciplinary team of graduate students, as part of an NSF-funded fellowship program at Oregon State University (OSU), to further investigate a potential sea otter reintroduction to Oregon. Here, I provide a brief overview of the program and my team’s goals for the coming year.
Source: Hakai Magazine.
The fellowship program emphasizes both interdisciplinary and transdisciplinary approaches, so before I explain the program, it’s important to first understand these terms. In short, interdisciplinarity typically relates to experts from different fields analyzing, synthesizing, and coordinating their work as a whole (Choi & Pak 2006). Another way to think about this, in more practical terms, is if two or more experts share information and learn from one another; each expert can then individually apply that information or lessons-learned to their own line of work. In contrast, transdisciplinary work is slightly more collaborative, where experts work more hand-in-hand to develop a product or solution that transcends their disciplines’ traditional boundaries. The experts essentially create a product that would not have been possible working in isolation. In practice, the product(s) that stems from inter- and transdisciplinary work – if they truly are inter- or transdisciplinary by definition – is potentially very different.
Source: Dr. Shoshanah Jacobs.
With an increasing interest in interdisciplinary work, the National Science Foundation (NSF) developed the National Research Traineeship (NRT) program to encourage select universities to develop and implement innovative and transformative models for training graduate students in STEM disciplines. After soliciting proposals, the NSF awarded OSU one of these NRT projects to support OSU’s Risk and Uncertainty Quantification in Marine Science NRT Program. OSU’s NRT program was born out of the recognition that much of the complexity of marine issues is largely due to the uncertainty of natural and human systems. Therefore, the primary purpose of this program is to train the next generation of natural resource scientists and managers to be better equipped to study and manage complex marine systems, especially under extreme uncertainty and potential risk.
Source: Oregon State University.
This NRT program trains graduate students in three core concept areas: coupled natural human systems, big data, and risk and uncertainty analyses and communications. To learn these core concepts, students fulfil a minor that includes coursework in statistical inference, uncertainty quantification, risk analyses, earth system science, and social systems. In addition to the minor, students also conduct collaborative research in small (3-5 students) cross-disciplinary teams to address specific issues in marine resource management. Within each team, students come from different disciplines and fields, and must learn to work together to produce a transdisciplinary research product. Throughout the year, each team will develop a set of research questions to address their issue at hand, conduct research which links all their fields, and produce a transdisciplinary report summarizing the process they undertook and the end product. Most students who are accepted into the NRT program are awarded one-year fellowships, funded by the NSF.
At the start of this academic year, I was awarded one of these NRT fellowships to address the many issues and implications of a potential sea otter reintroduction to Oregon. Over the next year, I will be working with two other OSU graduate students with backgrounds in genetics and social sciences. Our task is to not only investigate the ecological implications – which I am currently doing for my own thesis – but we are to expand this investigation to also address many of the genetic, political, and social factors, as well. While each of us is capable of addressing one of these factors individually, the real test will be in finding linkages between each of our disciplines to make this project truly transdisciplinary.
Structure and vision of OSU’s NRT program. Source: Oregon State University.
Since our project started, we have worked to better understand each another’s expertise, interests, and the general need for a transdisciplinary project of this sort. After acquiring this base understanding, we spent a considerable amount of time developing research questions and potential methods for addressing our issue. Throughout this process, it’s already become apparent that each of us is starting to learn important teamwork and collaboration skills, including effective communication and explanation of complicated concepts, active listening, critical thinking, and constructive feedback. While these skills are imperative for our research over the next year, they are also life-long skills that we’ll continue to use in our careers beyond graduate school.
As I’ve stated previously, learning to be an effective collaborator is extremely important to me. Getting the opportunity to work interdisciplinarily is what attracted me to my thesis, the marine resource management program, and the NRT program. By choosing to take my graduate education down this path, I’ve been fortunate to obtain important skills in collaboration, as well as work on a project that allows me to tackle real-world issues and creatively develop scientifically-based solutions. I have high hopes for this NRT project, and I’m excited to continue to conduct meaningful and targeted research over the next year with my new team.
2018-19 OSU NRT Cohort. Source: Oregon State University.
References:
Choi, B. C., and A. W. Pak. Multidisciplinarity, interdisciplinarity and transdisciplinarity in health research, service, education and policy: 1. Definitions, objectives, and evidence of effectiveness. Clinical and Investigative Medicine. 29(6): 351-64.
By Alexa Kownacki, Ph.D. Student, OSU Department of Fisheries and Wildlife, Geospatial Ecology of Marine Megafauna Lab
It all started with a paper. On Halloween, I sat at my desk, searching for papers that could answer my questions about bottlenose dolphin metabolism and realized I had forgotten to check my email earlier. In my inbox, there was a new message with an attachment from Dr. Leigh Torres to the GEMM Lab members, saying this was a “must-read” article. The suggested paper was Martin A. Schwartz’s 2008 essay, “The importance of stupidity in scientific research”, published in the Journal of Cell Science, highlighted universal themes across science. In a single, powerful page, Schwartz captured my feelings—and those of many scientists: the feeling of being stupid.
For the next few minutes, I stood at the printer and absorbed the article, while commenting out loud, “YES!”, “So true!”, and “This person can see into my soul”. Meanwhile, colleagues entered my office to see me, dressed in my Halloween costume—as “Amazon’s Alexa”, talking aloud to myself. Coincidently, I was feeling pretty stupid at that moment after just returning from a weekly meeting, where everyone asked me questions that I clearly did not have the answers to (all because of my costume). This paper seemed too relevant; the timing was uncanny. In the past few weeks, I have been writing my PhD research proposal —a requirement for our department— and my goodness, have I felt stupid. The proposal outlines my dissertation objectives, puts my work into context, and provides background research on common bottlenose dolphin health. There is so much to know that I don’t know!
Alexa dressed as “Amazon Alexa” on Halloween at her office in San Diego, CA.
When I read Schwartz’s 2008 paper, there were a few takeaway messages that stood out:
People take different paths. One path is not necessarily right nor wrong. Simply, different. I compared that to how I split my time between OSU and San Diego, CA. Spending half of the year away from my lab and my department is incredibly challenging; I constantly feel behind and I miss the support that physically being with other students provides. However, I recognize the opportunities I have in San Diego where I work directly with collaborators who teach and challenge me in new ways that bring new skills and perspective.
Drawing upon experts—albeit intimidating—is beneficial for scientific consulting as well as for our mental health; no one person knows everything. That statement can bring us together because when people work together, everyone benefits. I am also reminded that we are our own harshest critics; sometimes our colleagues are the best champions of our own successes. It is also why historical articles are foundational. In the hunt for the newest technology and the latest and greatest in research, it is important to acknowledge the basis for discoveries. My data begins in 1981, when the first of many researchers began surveying the California coastline for common bottlenose dolphins. Geographic information systems (GIS) were different back then. The data requires conversions and investigative work. I had to learn how the data were collected and how to interpret that information. Therefore, it should be no surprise that I cite literature from the 1970s, such as “Results of attempts to tag Atlantic Bottlenose dolphins, (Tursiops truncatus)” by Irvine and Wells. Although published in 1972, the questions the authors tried to answer are very similar to what I am looking at now: how are site fidelity and home ranges impacted by natural and anthropogenic processes. While Irvine and Wells used large bolt tags to identify individuals, my project utilizes much less invasive techniques (photo-identification and blubber biopsies) to track animals, their health, and their exposures to contaminants.
(Image source: imgflip.com)
Struggling is part of the solution. Science is about discovery and without the feeling of stupidity, discovery would not be possible. Feeling stupid is the first step in the discovery process: the spark that fuels wanting to explore the unknown. Feeling stupid can lead to the feeling of accomplishment when we find answers to those very questions that made us feel stupid. Part of being a student and a scientist is identifying those weaknesses and not letting them stop me. Pausing, reflecting, course correcting, and researching are all productive in the end, but stopping is not. Coursework is the easy part of a PhD. The hard part is constantly diving deeper into the great unknown that is research. The great unknown is simultaneously alluring and frightening. Still, it must be faced head on. Schwartz describes “productive stupidity [as] being ignorant by choice.” I picture this as essentially blindly walking into the future with confidence. Although a bit of an oxymoron, it resonates the importance of perseverance and conviction in the midst of uncertainty.
(Image source: Redbubble)
Now I think back to my childhood when stupid was one of the forbidden “s-words” and I question whether society had it all wrong. Maybe we should teach children to acknowledge ignorance and pursue the unknown. Stupid is a feeling, not a character flaw. Stupidity is important in science and in life. Fascination and emotional desires to discover new things are healthy. Next time you feel stupid, try running with it, because more often than not, you will learn something.
Alexa teaching about marine mammals to students ages 2-6 and learning from educators about new ways to engage young students. San Diego, CA in 2016. (Photo source: Lori Lowder)
By Dominique Kone, Masters Student in Marine Resource Management
Over the past year, the GEMM Lab has been investigating the ecological factors associated with a potential sea otter reintroduction to Oregon. A potential reintroduction is not only of great interest to our lab, but also to several other researchers, managers, tribes, and organizations in the state. With growing interest, this idea is really starting to gain momentum. However, the best path forward to making this idea a reality is somewhat unknown, and will no doubt take a lot of time and effort from multiple groups.
In an effort to catalyze this process, the Elakha Alliance – led by Bob Bailey – organized the Oregon Sea Otter Status of Knowledge Symposium earlier this month in Newport, OR. The purpose of this symposium was to share information, research, and lessons learned about sea otters in other regions. Speakers – primarily scientists, managers, and graduate students – flew in from all over the U.S. and the Canadian west coast to share their expertise and discuss various factors that must be considered before any reintroduction efforts begin. Here, I review some of the key takeaways from those discussions.
Source: The Elakha Alliance
To start the meeting, Dr. Anne Salomon – an associate professor from Simon Fraser University – and Kii’iljuus Barbara Wilson – a Haida Elder – gave an overview of the role of sea otters in nearshore ecosystems and their significance to First Nations in British Columbia. Hearing these perspectives not only demonstrated the various ecological effects – both direct and indirect – of sea otters, but it also illustrated their cultural connection to indigenous people and the role tribes can play (and currently do play in British Columbia) in co-managing sea otters. In Oregon, we need to be aware of all the possible effects sea otters may have on our ecosystems and acknowledge the opportunity we have to restore these cultural connections to Oregon’s indigenous people, such as the Confederated Tribes of Siletz Indians.
Source: The Elakha Alliance and the Confederated Tribes of Siletz Indians.
The symposium also involved several talks on the recovery of sea otter populations in other regions, as well as current limitations to their population growth. Dr. Lilian Carswell and Dr. Deanna Lynch – sea otter and marine conservation coordinators with the U.S. Fish & Wildlife Service – and Dr. Jim Bodkin – a sea otter ecologist – provided these perspectives. Interestingly, not all stocks are recovering at the same rate and each population faces slightly different threats. In California, otter recovery is slowed by lack of available food and mortality due to investigative shark bites, which prevents range expansion. In other regions, such as Washington, the population appears to be growing rapidly and lack of prey and shark bite-related mortality appear to be less important. However, this population does suffer from parasitic-related mortality. The major takeaway from these recovery talks is that threats can be localized and site-specific. In considering a reintroduction to Oregon, it may be prudent to investigate if any of these threats and population growth limitations exist along our coastline as they could decrease the potential for sea otters to reestablish.
Source: The Seattle Aquarium and U.S. Fish & Wildlife Service.
Dr. Shawn Larson – a geneticist and ecologist from the Seattle Aquarium – gave a great overview of the genetic research that has been conducted for historical (pre-fur trade) Oregon sea otter populations. She explained that historical Oregon populations were genetically-similar to both southern and northern populations, but there appeared to be a “genetic gradient” where sea otters near the northern Oregon coast were more similar to northern populations – ranging to Alaska – and otters from the southern Oregon coast were more similar to southern populations – ranging to California. Given this historic genetic gradient, reintroducing a mixture of sea otters – subsets from contemporary northern and southern stocks – should be considered in a future Oregon reintroduction effort. Source-mixing could increase genetic diversity and may more-closely resemble genetic diversity levels found in the original Oregon population.
At the end of the meeting, an expert panel – including Dr. Larson, Dr. Bodkins, Dr. Lynch, and Dr. Carswell – provided their recommendations on ways to better inform this process. To keep this brief, I’ll discuss the top three recommendations I found most intriguing and important.
Gain a better understanding of sea otter social behavior. Sea otters have strong social bonds, and previous reintroductions have failed because relocated individuals returned to their capture sites to rejoin their source populations. While this site fidelity behavior is relatively understood, we know less about the driving mechanisms – such as age or sex – of those behaviors. Having a sound understanding of these behaviors and their mechanisms could help to identify those which may hinder reestablishment following a reintroduction.
When anticipating the impacts of sea otters on ecosystems, investigate the benefits too. When we think of impacts, we typically think of costs. However, there are documented benefits of sea otters, such as increasing species diversity (Estes & Duggins 1995, Lee et al. 2016). Identifying these benefits – as well as to people – would more completely demonstrate their importance.
Investigate the human social factors and culture in Oregon relative to sea otters, such as perceptions of marine predators. Having a clear understanding of people’s attitudes toward marine predators – particularly marine mammals – could help managers better anticipate and mitigate potential conflicts and foster co-existence between otters and people.
Source: Paul Malcolm
While much of the symposium was focused on learning from experts in other regions, I would be remiss if I didn’t recognize the great talks given by a few researchers in Oregon – including Sara Hamilton (OSU doctoral student), Dr. Roberta Hall (OSU emeritus professor), Hannah Wellman (University of Oregon doctoral student), and myself. Individually, we spoke about the work that has already been done and is currently being done on this issue – including understanding bull kelp ecology, studying sea otter archaeological artifacts, and a synthesis of the first Oregon translocation attempt. Collectively, our talks provided some important context for everyone else in the room and demonstrated that we are working to make this process as informed as possible for managers. Oregon has yet to determine if they will move forward with a sea otter reintroduction and what that path forward will look like. However, given this early interest – as demonstrated by the symposium – we, as researchers, have a great opportunity to help guide this process and provide informative science.
References:
Estes, J. A. and D. O. Duggins. 1995. Sea otters and kelp forests in Alaska: generality and variation in a community ecological paradigm. Ecological Monographs. 65: 75-100.
Lee, L. C., Watson, J. C., Trebilco, R., and A. K. Salomon. 2016. Indirect effects and prey behavior mediate interactions between an endangered prey and recovering predator. Ecosphere. 7(12).
By Dominique Kone, Masters Student in Marine Resource Management
As I finish my first year of graduate school, I’ve been reflecting on what has helped me develop as a young scientist over the past year. Some of these lessons are somewhat expected: making time for myself outside of academia, reading the literature, and effectively managing my time. Yet, I’ve also learned that working with my peers, other scientists, and experts outside my scientific field can be extremely rewarding.
For my thesis, I will be looking at the potential to reintroduce sea otters to the Oregon coast by identifying suitable habitat and investigating their potential ecological impacts. During this first year, I’ve spent much time getting to know various stakeholder groups, their experiences with this issue, and any advice they may have to inform my work. Through these interactions, I’ve benefitted in ways that would not have been possible if I tried tackling this project on my own.
Source: Seapoint Center for Collaborative Leadership.
When I first started my graduate studies, I was eager to jump head first into my research. However, as someone who had never lived in Oregon before, I didn’t yet have a full grasp of the complexities and context behind my project and was completely unfamiliar with the history of sea otters in Oregon. By engaging with managers, scientists, and advocates, I quickly realized that there was a wealth of knowledge that wasn’t covered in the literature. Information from people who were involved in the initial reintroduction; theories behind the cause of the first failed reintroduction; and most importantly, the various political, social, and culture implications of a potential reintroduction. This information was crucial in developing and honing my research questions, which I would have missed if I had solely relied on the literature.
As my first year in graduate school progressed, I also quickly realized that most people familiar with this issue also had strong opinions and views about how I should conduct my study, whether and how managers should bring sea otters back, and if such an effort will succeed. This input was incredibly helpful in getting to know the issue, and also fostered my development as a scientist as I had to quickly improve my listening and critically-thinking skills to consider my research from different perspectives. One of the benefits of collaboration – particularly with experts outside the marine ecology or sea otter community – is that everyone looks at an issue in a different way. Through my graduate program, I’ve worked with students and faculty in the earth, oceanic, and atmospheric sciences, whom have challenged me to consider other sources of data, other analyses, or different ways of placing my research within various contexts.
Most graduate students when they first start graduate school. Source: Know Your Meme.
One of the major advantages of being a graduate student is that most researchers – including professors, faculty, managers, and fellow graduate students – are more than happy to analyze and discuss my research approach. I’ve obtained advice on statistical analyses, availability and access to data, as well as contacts to other experts. As a graduate student, it’s important for me to consult with more-experienced researchers who can not only explain complex theories or concepts, but who can also validate the appropriateness of my research design and methods. Collaborating with senior researchers is a great way to become established and recognized within the scientific community. Because of this project, I’ve started to become adopted into the marine mammal and sea otter research communities, which is obviously beneficial for my thesis work, but also allows me to start building strong relationships for a career in marine conservation.
Source: Oregon State University.
Looking ahead to my second year of graduate school, I’m eager to make a big push toward completing my thesis, writing manuscripts for journal submission, and communicating my research to various audiences. Throughout this process, it’s still important for me to continue to reach out and collaborate with others within and outside my field as they may help me reach my personal goals. In my opinion, this is exactly what graduate students should be doing. While graduate students may have the ability and some experience to work independently, we are still students, and we are here to learn from and make lasting connections with other researchers and fellow graduate students through these collaborations.
If there’s any advice I would give to an incoming graduate student, it’s this: Collaborate, and collaborate often. Don’t be afraid to work with others because you never know whether you’ll come away with a new perspective, learn something new, come across new research or professional opportunities, or even help others with their research.


You must be logged in to post a comment.