By Dominique Kone1 and Sara Hamilton2
1Masters Student in Marine Resource Management, 2Doctoral Student in Integrative Biology
Five years ago, the North Pacific Ocean experienced a sudden increase in sea surface temperature (SST), known as the warm blob, which altered marine ecosystem function and structure (Leising et al. 2015). Much research illustrated how the warm blob impacted pelagic ecosystems, with relatively less focused on the nearshore environment. Yet, a new study demonstrated how rising ocean temperatures have partially led to bull kelp loss in northern California. Unfortunately, we are once again observing similar warming trends, representing the second largest marine heatwave over recent decades, and signaling the potential rise of a second warm blob. Taken together, all these findings could forecast future warming-related ecosystem shifts in Oregon, highlighting the need for scientists and managers to consider strategies to prevent future kelp loss, such as reintroducing sea otters.
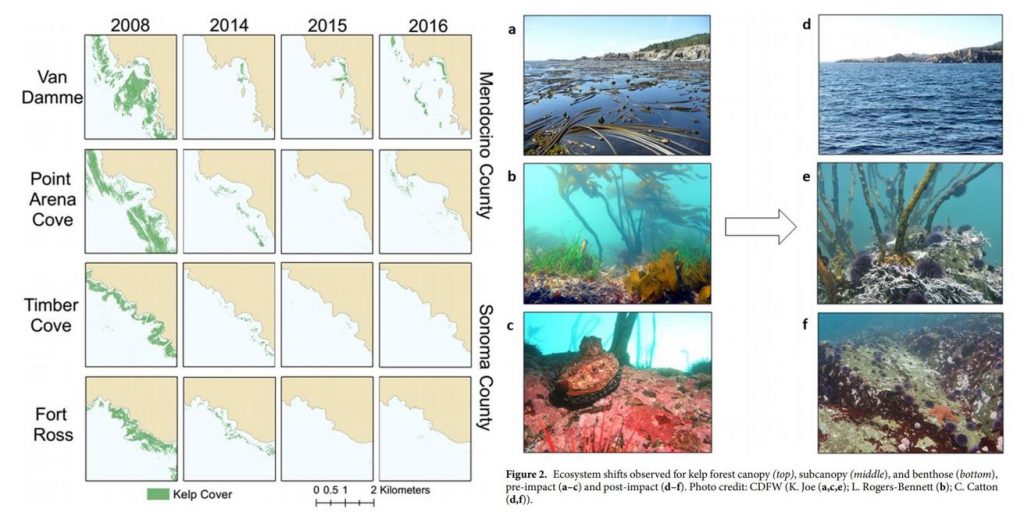
In northern California, researchers observed a dramatic ecosystem shift from productive bull kelp forests to purple sea urchin barrens. The study, led by Dr. Laura Rogers-Bennett from the University of California, Davis and California Department of Fish and Wildlife, determined that this shift was caused by multiple climatic and biological stressors. Beginning in 2013, sea star populations were decimated by sea star wasting disease (SSWD). Sea stars are a main predator of urchins, causing their absence to release purple urchins from predation pressure. Then, starting in 2014, ocean temperatures spiked with the warm blob. These two events created nutrient-poor conditions, which limited kelp growth and productivity, and allowed purple urchin populations to grow unchecked by predators and increase grazing on bull kelp. The combined effect led to approximately 90% reductions in bull kelp, with a reciprocal 60-fold increase in purple urchins (Figure 1).

These changes have wrought economic challenges as well as ecological collapse in Northern California. Bull kelp is important habitat and food source for several species of economic importance including red abalone and red sea urchins (Tegner & Levin 1982). Without bull kelp, red abalone and red sea urchin populations have starved, resulting in the subsequent loss of the recreational red abalone ($44 million) and commercial red sea urchin fisheries in Northern California. With such large kelp reductions, purple urchins are also now in a starved state, evidenced by noticeably smaller gonads (Rogers-Bennett & Catton 2019).
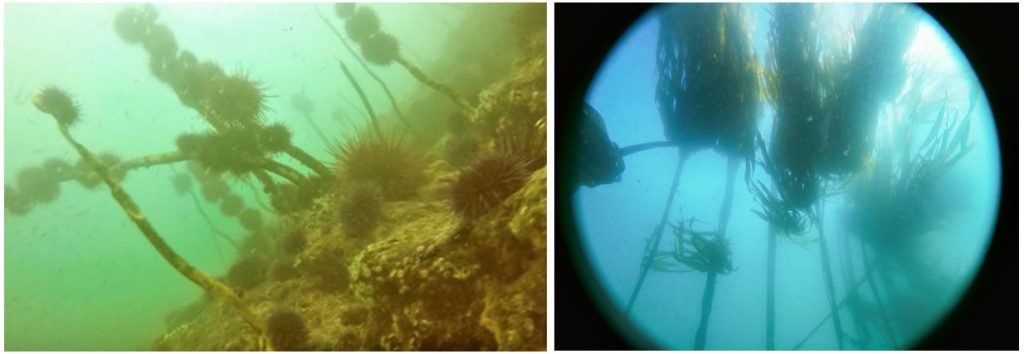
Biogeographically, southern Oregon is very similar to northern California, as both are composed of complex rocky substrates and shorelines, bull kelp canopies, and benthic macroinvertebrates (i.e. sea urchins, abalone, etc.). Because Oregon was also impacted by the 2014-2015 warm blob and SSWD, we might expect to see a similar coastwide kelp forest loss along our southern coastline. The story is more complicated than that, however. For instance, ODFW has found purple urchin barrens where almost no kelp remains in some localized places. The GEMM Lab has video footage of purple urchins climbing up kelp stalks to graze within one of these barrens near Port Orford, OR (Figure 2, left). In her study, Dr. Rogers-Bennett explains that this aggressive sea urchin feeding strategy is potentially a sign of food limitation, where high-density urchin populations create intense resource competition. Conversely, at sites like Lighthouse Reef (~45 km from Port Orford) outside Charleston, OR, OSU and University of Oregon divers are currently seeing flourishing bull kelp forests. Urchins at this reef have fat, rich gonads, which is an indicator of high-quality nutrition (Figure 2, right).
Satellites can detect kelp on the surface of the water, giving scientists a way to track kelp extent over time. Preliminary results from Sara Hamilton’s Ph.D. thesis research finds that while some kelp forests have shrunk in past years, others are currently bigger than ever in the last 35 years. It is not clear what is driving this spatial variability in urchin and kelp populations, nor why southern Oregon has not yet faced the same kind of coastwide kelp forest collapse as northern California. Regardless, it is likely that kelp loss in both northern California and southern Oregon may be triggered and/or exacerbated by rising temperatures.

The reintroduction of sea otters has been proposed as a solution to combat rising urchin populations and bull kelp loss in Oregon. From an ecological perspective, there is some validity to this idea. Sea otters are a voracious urchin predator that routinely reduce urchin populations and alleviate herbivory on kelp (Estes & Palmisano 1974). Such restoration and protection of bull kelp could help prevent red abalone and red sea urchin starvation. Additionally, restoring apex predators and increasing species richness is often linked to increased ecosystem resilience, which is particularly important in the face of global anthropogenic change (Estes et al. 2011)
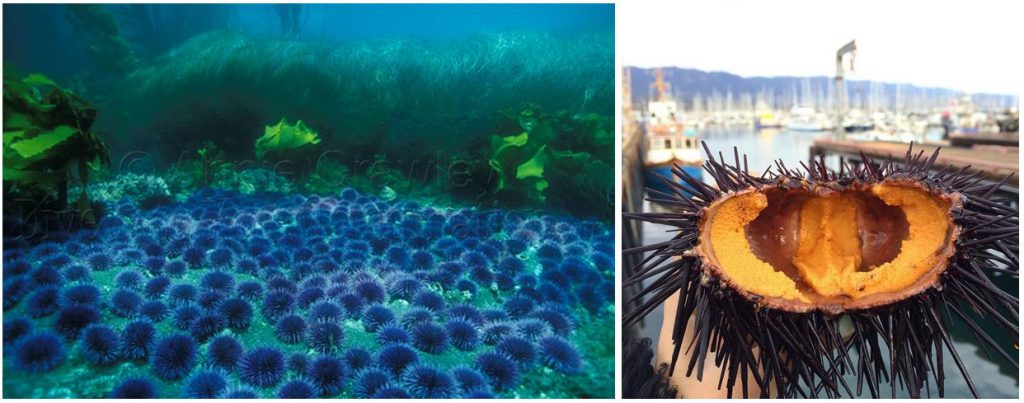
While sea otters could alleviate grazing pressure on Oregon’s bull kelp, this idea only looks at the issue from a top-down, not bottom-up, perspective. Sea otters require a lot of food (Costa 1978, Reidman & Estes 1990), and what they eat will always be a function of prey availability and quality (Ostfeld 1982). Just because urchins are available, doesn’t mean otters will eat them. In fact, sea otters prefer large and heavy (i.e. high gonad content) urchins (Ostfeld 1982). In the field, researchers have observed sea otters avoiding urchins at the center of urchin barrens (personal communication), presumably because those urchins have less access to kelp beds than on the barren periphery, and therefore, are constantly in a starved state (Konar & Estes 2003) (Figure 3). These findings suggest prey quality is more important to sea otter survival than just prey abundance.

Purple urchin quality has not been widely assessed in Oregon, but early results show that gonad size varies widely depending on urchin density and habitat type. In places where urchin barrens have formed, like Port Orford, purple urchins are likely starving and thus may be a poor source of nutrition for sea otters. Before we decide whether sea otters are a viable tool to combat kelp loss, prey surveys may need to be conducted to assess if a sea otter population could be sustained based on their caloric requirements. Furthermore, predictions of how these prey populations may change due to rising temperatures could help determine the potential for sea otters to become reestablished in Oregon under rapid environmental change.
Recent events in California could signal climate-driven processes that are already impacting some parts of Oregon and could become more widespread. Dr. Rogers-Bennett’s study is valuable as she has quantified and described ecosystem changes that might occur along Oregon’s southern coastline. The resurgence of a potential second warm blob and the frequency between these warming events begs the question if such temperature spikes are still anomalous or becoming the norm. If the latter, we could see more pronounced kelp loss and major shifts in nearshore ecosystem baselines, where function and structure is permanently altered. Whether reintroducing sea otters can prevent these changes will ultimately depend on prey and habitat availability and quality, and should be carefully considered.
References:
Costa, D. P. 1978. The ecological energetics, water, and electrolyte balance of the California sea otter (Enhydra lutris). Ph.D. dissertation, University of California, Santa Cruz.
Estes, J. A. and J.F. Palmisano. 1974. Sea otters: their role in structuring nearshore communities. Science. 185(4156): 1058-1060.
Estes et al. 2011. Trophic downgrading of planet Earth. Science. 333(6040): 301-306.
Harvell et al. 2019. Disease epidemic and a marine heat wave are associated with the continental-scale collapse of a pivotal predator (Pycnopodia helianthoides). Science Advances. 5(1).
Konar, B., and J. A. Estes. 2003. The stability of boundary regions between kelp beds and deforested areas. Ecology. 84(1): 174-185.
Leising et al. 2015. State of California Current 2014-2015: impacts of the warm-water “blob”. CalCOFI Reports. (56): 31-68.
Ostfeld, R. S. 1982. Foraging strategies and prey switching in the California sea otter. Oecologia. 53(2): 170-178.
Reidman, M. L. and J. A. Estes. 1990. The sea otter (Enhydra lutris): behavior, ecology, and natural history. United States Department of the Interior, Fish and Wildlife Service, Biological Report. 90: 1-126.
Rogers-Bennett, L., and C. A. Catton. 2019. Marine heat wave and multiple stressors tip bull kelp forest to sea urchin barrens. Scientific Reports. 9:15050.
Tegner, M. J., and L. A. Levin. 1982. Do sea urchins and abalones compete in California? International Echinoderms Conference, Tampa Bay. J. M Lawrence, ed.


You must be logged in to post a comment.