Understanding How Nature Works

By: Erin Pickett, MS student, Oregon State University

They were climbing on their hands and knees along a high, narrow ridge that was in places only two inches wide. The path, if you could call it that, was layered with sand and loose stones that shifted whenever touched. Down to the left was a steep cliff encrusted with ice that glinted when the sun broke down through the thick clouds. The view to the right, with a 1,000ft drop, wasn’t much better.

The Invention of Nature by Andrea Wulf

This is a description of Alexander von Humboldt and the two men that accompanied him when attempting to summit Chimborazo, which in 1802 was believed to be the highest mountain in the world. The trio was thwarted about 1,000 ft from the top of the peak by an impassable crevice but set a record for the highest any European had ever climbed. This was a scientific expedition. With them the men brought handfuls of scientific instruments and Humboldt identified and recorded every plant and animal species along the way. Humboldt was an explorer, a naturalist, and an observer of everything. He possessed a memory that allowed him to recount details of nature that he had observed on a mountain in Asia, and find patterns and connections between that mountain and another in South America. His perspective of nature as being interconnected, and theories as to why and how this was so, led to him being called the father of Ecology. In less grandeur terms, Humboldt was a biodiversity explainer.

Humboldt sketched detailed images like this one of Chimborazo, which allowed him to map vegetation and climate zones and identify how these and other patterns and processes were related. Source: http://www.mappingthenation.com/blog/alexander-von-humboldt-master-of-infographics/

In a recent guest post on Carbon Brief, University of Connecticut Professor Mark Urban summarized one of his latest publications in the journal Science, and called on scientists to progress from biodiversity explainers to biodiversity forecasters.  Today, as global biodiversity is threatened by climate change, one of our greatest scientific problems has become accurately forecasting the responses of species and ecosystems to climate change. Earlier this month, Urban and his colleagues published a review paper in Science titled “Improving the forecast for biodiversity under climate change”. Many of our current models aimed at predicting species responses to climate change, the authors noted, are missing crucial data that hamper the accuracy and thus the predictive capabilities of these models. What does this mean exactly?

Say we are interested in determining whether current protected areas will continue to benefit the species that exist inside their boundaries over the next century. To do this, we gather basic information about these species: what habitat do they live in, and where will this habitat be located in 100 years? We tally up the number of species currently inhabiting these protected areas, figure out the number of species that will relocate as their preferred habitat shifts (e.g. poleward, or higher in elevation) and then we subtract those species from our count of those who currently exist within the boundaries of this protected area. Voilà, we can now predict that we will lose up to 20% of the species within these protected areas over the next 100 years*.  Now we report our findings to the land managers and environmental groups tasked with conserving these species and we conclude that these protected areas will not be sufficient and they must do more to protect these species. Simple right? It never is.

This predication, like many others, was based on a correlation between these species ranges and climate. So what are we missing? In their review, Urban et al. outline six key factors that are commonly left out of predictive models, and these are: species interactions, dispersal, demography, physiology, evolution and environment (specifically, environment at appropriate spatiotemporal scales) (Figure 1). In fact, they found that more than 75% of models aimed at predicting biological responses to climate change left out these important biological mechanisms. Since my master’s project is centered on species interactions, I will now provide you with a little more information about why this specific mechanism is important, and what we might have overlooked by not including species interactions in the protected area example above.

Figure 1: Six critical biological mechanisms missing from current biodiversity forecasts. Source: Urban et al. 2016

I study Adelie and gentoo penguins, two congeneric penguin species whose breeding ranges overlap in a few locations along the Western Antarctic Peninsula. You can read more about my research in previous blog posts like this one. Similar to many other species around the world, both of these penguins are experiencing poleward range shifts due to atmospheric warming. The range of the gentoo penguin is expanding farther south than ever before, while the number of Adelie penguins in these areas is declining rapidly (Figure 2). A correlative model might predict that Adelie penguin populations will continue to decline due to rising temperatures, while gentoo populations will increase. This model doesn’t exactly inform us of the underlying mechanisms behind what we are observing. Are these trends due to habitat shifts? Declines in key prey species? Interspecific competition? If Adelie populations are declining due to increased competition with other krill predators (e.g. gentoo penguins), then any modelling we do to predict future Adelie population trends will certainly need to include this aspect of species interaction.

Figure 2. A subset of the overall range of Adelie and gentoo penguins and their population trends at my study site at Palmer Station 1975-2014. Source: https://www.allaboutbirds.org/on-the-antarctic-peninsula-scientists-witness-a-penguin-revolution/

Range expansion can result in novel or altered species interactions, which ultimately can affect entire ecosystems. Our prediction above that 20% of species within protected areas will be lost due to habitat shifts does not take species interactions into account. While some species may move out of these areas, others may move in. These new species may potentially outcompete those who remain, resulting in a net loss of species larger than originally predicted. Urban et al. outline the type of data needed to improve the accuracy of predictive models. They openly recognize the difficulties of such a task but liken it to the successful, collective effort of climate scientists over the past four decades to improve the predictive capabilities of climate forecasts.

As a passionate naturalist and philosopher, there is no doubt Humboldt would agree with Urban et al.’s conclusion that “ultimately, understanding how nature works will provide innumerable benefits for long-term sustainability and human well-being”. I encourage you to read the review article yourself if you’re interested in more details on Urban et al.’s views of a ‘practical way forward’ in the field of biodiversity forecasting. For a historical and perhaps more romantic account of the study of biodiversity, check out Andrea Wulf’s biography of Alexander von Humboldt, called The Invention of Nature.

 *This is an oversimplified example based off of a study on biodiversity and climate change in U.S. National parks (Burns et al. 2003)

References:

Burns, C. E., Johnston, K. M., & Schmitz, O. J. (2003). Global climate change and mammalian species diversity in US national parks. Proceedings of the National Academy of Sciences100(20), 11474-11477.

Urban, M. 14 September 2016. Carbon Brief. Guest post: How data is key to conserving wildlife in a challenging environment. From: https://www.carbonbrief.org/guest-post-data-key-conserving-wildlife-changing-climate (Accessed: 22 September 2016)

Urban, M. C., Bocedi, G., Hendry, A. P., Mihoub, J. B., Pe’er, G., Singer, A., … & Gonzalez, A. (2016). Improving the forecast for biodiversity under climate change. Science353(6304), aad8466.

Wulf, A. (2015). The Invention of Nature: Alexander Von Humboldt’s New World. Knopf Publishing Group.

Oceanus Day Three: Dolphin Delights

by Florence Sullivan, MSc student

Our third day aboard the Oceanus began in the misty morning fog before the sun even rose. We took the first CTD cast of the day at 0630am because the physical properties of the water column do not change much with the arrival of daylight. Our ability to visually detect marine mammals, however, is vastly improved with a little sunlight, and we wanted to make the best use of our hours at sea possible.

Randall Munroe www.XKCD.com

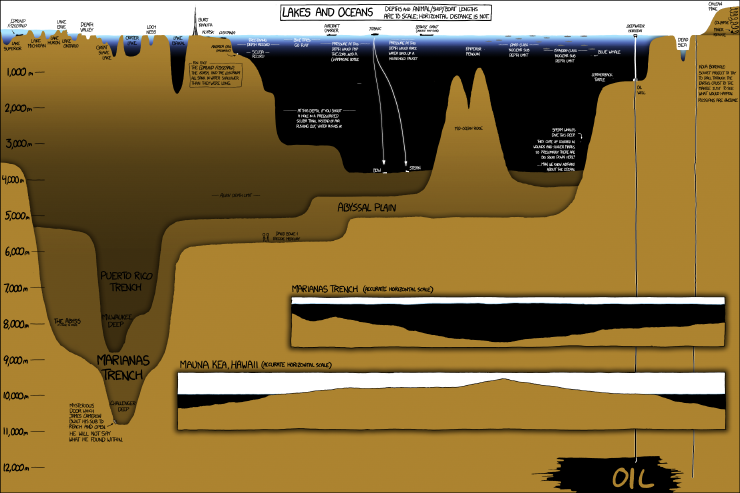
Our focus on day three was the Astoria canyon – a submarine feature just off the Oregon and Washington coast. Our first oceanographic station was 40 miles offshore, and 1300 meters deep, while the second was 20 miles offshore and only 170 meters deep.  See the handy infographic below to get a perspective on what those depths mean in the grand scheme of things.  From an oceanographic perspective, the neatest finding of the day was our ability to detect the freshwater plume coming from the Columbia River at both those stations despite their distance from each other, and from shore! Water density is one of the key characteristics that oceanographers use to track parcels of water as they travel through the ocean conveyor belt. Certain bodies of water (like the Mediterranean Sea, or the Atlantic or Pacific Oceans) have distinct properties that allow us to recognize them easily. In this case, it was very exciting to “sea” the two-layer system we had gotten used to observing overlain with a freshwater lens of much lower salinity, higher temperature, and lower density. This combination of freshwater, saltwater, and intriguing bathymetric features can lead to interesting foraging opportunities for marine megafauna – so, what did we find out there?

Click through link for better resolution: Randall Munroe www.XKCD.com/1040/large

Morning conditions were almost perfect for marine mammal observations – glassy calm with low swell, good, high, cloud cover to minimize glare and allow us to catch the barest hint of a blow….. it should come as no surprise then, that the first sightings of the day were seabirds and tuna!

I didn't catch any photos of the Tuna, so here's some mola mola we spotted. photo credit: Florence Sullivan
I didn’t catch any photos of the tuna, so here’s some sunfish we spotted. photo credit: Florence Sullivan

One of the best things about being at sea is the ability to look out at the horizon and have nothing but water staring back at you. It really drives home all the old seafaring superstitions about sailing off the edge of the world.  This close to shore, and in such productive waters, it is rare to find yourself truly alone, so when we spot a fishing trawler, there’s already a space to note it in the data log.  Ships at sea often have “follower” birds – avians attracted by easy meals as food scraps are dumped overboard. Fishing boats usually attract a lot of birds as fish bycatch and processing leftovers are flushed from the deck.  The birders groan, because identification and counts of individuals get more and more complicated as we approach other vessels.  The most thrilling bird sighting of the day for me were the flocks of a couple hundred fork-tailed storm petrels.

Fork-tailed storm petrels
Fork-tailed storm petrels. photo credit: Florence Sullivan

I find it remarkable that such small birds are capable of spending 80% of their life on the open ocean, returning to land only to mate and raise a chick. Their nesting strategy is pretty fascinating too – in bad foraging years, the chick is capable of surviving for several days without food by going into a state of torpor. (This slows metabolism and reduces growth until an adult returns.)

Just because the bird observers were starting to feel slightly overwhelmed, doesn’t mean that the marine mammal observers stopped their own survey.  The effort soon paid off with shouts of “Wait! What are those splashes over there?!” That’s the signal for everyone to get their binoculars up, start counting individuals, and making note of identifying features like color, shape of dorsal fin, and swimming style so that we can make an accurate species ID. The first sighting, though common in the area, was a new species for me – Pacific white sided dolphins!

Pacific white sided dolphin
A Pacific white sided dolphin leaps into view. photo credit: Florence Sullivan. Taken under NMFS permit 16111 John Calambokidis

A pod of thirty or so came to ride our bow wake for a bit, which was a real treat. But wait, it got better! Shortly afterward, we spotted more activity off the starboard bow.  It was confusing at first because we could clearly see a lot of splashes indicating many individuals, but no one had glimpsed any fins to help us figure out the species. As the pod got closer, Leigh shouted “Lissodelphis! They’re lissodelphis!”  We couldn’t see any dorsal fins, because northern right whale dolphins haven’t got one! Then the fly bridge became absolute madness as we all attempted to count how many individuals were in the pod, as well as take pictures for photo ID. It got even more complicated when some more pacific white sided dolphins showed up to join in the bow-riding fun.

Northern right whale dolphins are hard to spot! photo credit: Florence Sullivan Taken under NMFS permit 16111 John Calambokidis

All told, our best estimates counted about 200 individuals around us in that moment. The dolphins tired of us soon, and things continued to calm down as we moved further away from the fishing vessels.  We had a final encounter with an enthusiastic young humpback who was breaching and tail-slapping all over the place before ending our survey and heading towards Astoria to make our dock time.

Humpback whale breach
Humpback whale breach. photo credit: Florence Sullivan. Taken under NMFS permit 16111 John Calambokidis

As a Washington native who has always been interested in a maritime career, I grew up on stories of The Graveyard of the Pacific, and how difficult the crossing of the Columbia River Bar can be. Many harbors have dedicated captains to guide large ships into the port docks.  Did you know the same is true of the Columbia River Bar?  Conditions change so rapidly here, the shifting sands of the river mouth make it necessary for large ships to receive a local guest pilot (often via helicopter) to guide them across.  The National Motor Lifeboat School trains its students at the mouth of the river because it provides some of “the harshest maritime weather conditions in the world”.  Suffice it to say, not only was I thrilled to be able to detect the Columbia River plume in our CTD profile, I was also supremely excited to finally sail across the bar.  While a tiny part of me had hoped for a slightly more arduous crossing (to live up to all the stories you know), I am happy to report that we had glorious, calm, sunny conditions, which allowed us all to thoroughly enjoy the view from the fly bridge.

Cape Disappointment Lighthouse at the Columbia River Bar.

Finally, we arrived in Astoria, loaded all our gear into the ship’s RHIB (Ridged Hulled Inflatable Boat), lowered it into the river, descended the rope ladder, got settled, and motored into port. We waved goodbye to the R/V Oceanus, and hope to conduct another STEM cruise aboard her again soon.

Now if the ground would stop rolling, that would be just swell.

Last but not least, here are the videos we promised you in Oceanus Day Two – the first video shows the humpback lunge feeding behavior, while the second shows tail slapping. Follow our youtube channel for more cool videos!


Oceanus Day Two: All the Albatrosses

By Amanda Holdman and Florence Sullivan

Today got off to a bright and early start. As soon as daylight permitted, we had spotters out on duty looking for more marine mammals. We began to survey at the north end of Heceta bank, where we again encountered many humpback whales lunge feeding. We broke transect, and got some great video footage of a pair them – so check our youtube channel next week – we’ll upload the video as soon as we get back to better internet (dial up takes some getting used to again – the whales don’t know about highspeed yet).

Humpbacks lunge feeding at surface. photo credit: Leigh Torres. Taken under NMFS permit 16111 John Calambokidis.

After working with the humpbacks to capture photo-id data for about an hour, we turned south, and ran parallel to Heceta bank until we reached the southern edge. Along the way, we counted 30 humpbacks, and many California gulls, marbled murrelets, pink footed shearwaters, and sooty shearwaters.

After lunch, we conducted a CTD cast to see how conditions might be different between the southern and northern edges of the bank. Surface temperatures increased from 12.09C to 13.2C while bottom temperatures decreased from 8.7C to 7.8C.  The northern station was a textbook perfect two layer system. It had a well mixed surface layer with a steep pycnocline separating it from the colder, saltier, denser, bottom layer. The southern station still had two layers, but the pycnocline (the depth where a rapid change in density occurs, which delineates the edges of water masses) was not as steep. We are interested in these discreet measurements of ocean conditions because areas of high primary productivity (the green chlorophyll-a line) are often re-occurring hot spots of food for many levels of the food chain. Since we can’t phone the whales and ask them where to meet up, we use clues like these to anticipate the best place to start looking.

Readout of the CTD cast. The left plot has temperature in blue, and salinity in green. The right plot has density in black, chlorophyll-a in green, and oxygen in blue. observe how different variables change with depth!
Readout of the CTD cast. The left plot has temperature in blue, and salinity in green. The right plot has density in black, chlorophyll-a in green, and oxygen in blue. observe how different variables change with depth (on the y-axes)!

We next turned west to transect the continental shelf break. Here, we were hoping to observe changes in species composition as waters got deeper, and habitat changed.  The shelf break is often known as an area of upwelling and increased primary productivity, which can lead to concentrations of marine predators taking advantage of aggregations of prey. As we moved further offshore, everyone was hoping for some sperm whales, or maybe some oceanic dolphin species, and if we’re really lucky, maybe a beaked whale or two.

Black footed Albatross with immature gulls. photo credit: Leigh Torres

Today our students learned the lesson of how difficult marine mammal observation can be when our target species spend the majority of their lives underwater – where we can’t see them. While there were a couple of hours of mammal empty water in there, observers were kept busy identifying long tailed- jaegers, cassin’s auklets, murrelets, petrels, shearwaters, fulmars, and so many black-footed albatrosses, that they almost became “normal”.  That being said, we did spot a fin whale, a few groups of Dall’s porpoise, and three pacific-white-sided dolphins.  Unexpectedly, we also saw an unidentified shark, and several sunfish (mola mola)!

Humpback whale profile. photo credit: Amanda Holdman. Taken under NMFS permit 16111 John Calambokidis.
Humpback whale profile – notice the hump before the dorsal fin. photo credit: Amanda Holdman. Taken under NMFS permit 16111 John Calambokidis.
Fin Whale profile. photo credit: Amanda Holdman. Taken under NMFS permit 16111 John Calambokidis.
Fin Whale profile – notice how long the back is before the fin, and how pointed the dorsal fin is compared to the humpback. photo credit: Amanda Holdman. Taken under NMFS permit 16111 John Calambokidis.

Last but not least, we engaged in a long standing oceanographic tradition, which is to draw on Styrofoam cups, and send them down to Davy Jone’s Locker attached to the CTD.  When you bring them back up, the pressure has caused them to shrink to a fraction of their original size, which is an excellent demonstration of the crushing power of pressure (and why its harder to build a submarine than a rocket).

Shrunken cups! The first row have been sent down to 1400m, while the back row are still full size!

Now, we are steaming north toward Astoria Canyon, where we hope to make some more sightings in the morning. Stand by for news from our final day at sea.

Fin Whale. photo credit Amanda Holdman. Taken under NMFS permit 16111 John Calambokidis.
Dahl's Porpoise. photo credit: Florence Sullivan. Taken under NMFS permit 16111 John Calambokidis.
Dahl’s Porpoise. photo credit: Florence Sullivan. Taken under NMFS permit 16111 John Calambokidis.

R/V Oceanus Day One: Hungry Hungry Humpbacks

By Florence Sullivan and Amanda Holdman

The GEMM lab is adventuring out into the wild blue yonder of open ocean sampling and educational outreach! Leigh is the chief scientist onboard the R/V Oceanus for the next two days as we sail through Oregon waters in search of marine megafauna. Also onboard are four local teachers and five high school students who are learning the tricks of the trade. Amanda and I are here to help teach basic oceanography and distance sampling techniques to our enthusiastic students.

Science Party musters in the dry lab for safety debrief. photo credit: Florence Sullivan

We started the morning with safety briefings, and headed out through the Newport breakwater, direction: Stonewall Bank.  Stonewall is a local bathymetric feature where upwelling often occurs, leading to a productive ecosystem for both predators and prey. Even though our main sampling effort will be offshore this trip, we didn’t even make out of the harbor before recording our first gray whale and California sea lion sightings.

California Sea Lions on the Newport buoy. Taken under NMFS permit 16111 John Calambokidis

Our students (and their teachers) are eager and quick to catch on as we teach them new methodologies. Amanda and I had prepared presentations about basic oceanographic and distance sampling methods, but really the best way to learn is to jump in and go. We’ve set up a rotation schedule, and everyone is taking turns scanning the ocean for critters, deploying and recovering the CTD, logging data, and catching plankton.

a small pod of Orca. Photo credit: Florence Sullivan. Taken under NMFS permit 16111 John Calambokidis
A small pod of Orca. Photo credit: Florence Sullivan. Taken under NMFS permit 16111 John Calambokidis

So far, we have spotted gray whales, sea lions, a pod of (lightning speed) killer whales, lots of seagulls, northern fulmars, sooty shearwaters, storm petrels, and cormorants, but today’s highlight has to the last sighting of ~42 humpback whales. We found them at the Northern edge of Heceta Bank – a large rocky reef which provides structural habitat for a wide variety of marine species. As we approached the area, we spotted one whale, and then another. At first, our spotters had no trouble inputting the data, getting photo-ID shots, and distinguishing one whale from the next, but as we continued, we were soon overwhelmed. With whale blows surrounding us on all sides, it was hard to know where to look first – here a surface lunge, there, a breach, a spout, a fluke, a flipper slap! The surface activity was so dense and enthralling, it took a few moments before realizing there were some sea lions in the feeding frenzy too!

Five humpback whales surface at once. photo credit: Leigh Torres. Taken under NMFS permit 16111 John Calambokidis

We observed the group, and tried to document as many individuals as possible as the sunset faded into night. When poor visibility put a stop to the visuals, we hurried to do a plankton tow and CTD cast to find some environmental insights for such a gathering. The CTD revealed a stratified water column, with two distinct layers, and the plankton tow brought up lots of diatoms and krill. As one of the goals of this cruise is to explore how marine mammals vary with ocean gradients, this is a pretty cool way to start.

A humpback whale lunge feeds. Photo credit: Leigh Torres. Taken under NMFS permit 16111 John Calambokidis

A long day observing has left us all exhausted, but not too tired to share our excitement. Stay tuned for more updates from the briny blue!

Follow this link for real time view of our beautiful ship! : http://webcam.oregonstate.edu/oceanus

Humpback flukes for photo ID. photo credit: Leigh Torres. Taken under NMFS permit 16111 John Calambokidis

Blue whale portraits: pieces of the puzzle

By Dawn Barlow, MSc Student, Oregon State University

Perhaps you’ve read some posts about New Zealand blue whales on this blog from the past field season in the South Taranaki Bight (STB). I know I eagerly awaited updates from the field while the team was in New Zealand and I was in Southern California, finishing undergrad and writing funding proposals and grad school applications. Now that undergrad is done and dusted, I’ve arrived in Newport and begun to settle in to my next chapter as the newest member of the GEMM Lab, joining the blue whale research team as a MSc student in OSU’s Department of Fisheries and Wildlife. Since no blue whale news has made it onto this blog in some time, I’m excited to share what has happened since the team returned from the field!

As you may have heard from Leigh, Callum, and Kristin, 2016 was a fruitful field season. In nearly 1,500 miles of vessel surveys, the team documented blue whale foraging behavior, a pair of racing whales, four mother-calf pairs, what may be the first aerial footage of nursing behavior in baleen whales (video below), and a whale with apparent deformities. Five hydrophones units were deployed, fecal and biopsy samples were collected, oceanographic conditions were measured, and photos were taken.

I was welcomed into the GEMM Lab in early July, and presented with a workspace, a hard drive with thousands of photos, new software programs to learn, wonderfully accessible tea and coffee, and tasked with creating a photo-ID catalog of all the blue whales our team photographed this past field season. Here’s a great thing about blue whales: while they may be tricky to study, when someone sees a blue whale they are often excited to report it. In addition to the data collected by our team during the 2016 season and the 2014 pilot season, we are incorporating many photo-documented sightings of blue whales from all around New Zealand that we have received from collaborative researchers, whale watch organizations, and fishing vessels alike captured between 2004 and 2016. All these photos are precious data to us, as we can use them to better understand their ecology.

There are many unanswered questions about this population of blue whales in New Zealand — How many are there? Just how big are they? Do they stay in New Zealand year-round or are they migratory? Through the photo-ID analysis that I’ve done, we are just beginning to piece together some answers. We have now compiled records of sightings in New Zealand from every month of the year. I’ve identified 94 unique individual blue whales, 26 of which were sighted in the STB during the 2016 season. Five whales were seen in multiple years (Figure 1), including one whale that was seen in three different years, in three different places, and with three different calves! And what might all of this mean? At this point it’s still speculative, but these findings hint at year-round residency and seasonal movement patterns within New Zealand waters… with more data and more analysis I will be able to say these things more conclusively.

New Zealand Blue Whale Photo-ID

NZ Blue Whale Photo-ID
Figure 1. Blue whale photographed off of Westport on 31 January 2013 (above) by the Australian Antarctic Division (data provided by Mike Double), and in the South Taranaki Bight on 2 February 2016 (below). Note how the tear in the dorsal fin has healed over the three-year period.

Perhaps you’ve read Leila’s post about photogrammetry, and how she is able to make measurements using aerial photographs captured using an Unmanned Aerial System (UAS, aka ‘drone’). Using the same method, I will soon be able to tell you how long these whales really are (Figure 2).

sighting 22 UAS reduced
Figure 2. An aerial photograph captured with the UAS during the 2016 season, which will be used to measure the length of these whales using photogrammetry.

How many of them are there? Well, that’s a trickier question. Using a straightforward abundance calculation based on our rate of re-sightings, the estimate I came up with is 594 ± 438. In other words, I can say with 95% confidence that there are between 156 and 1031 blue whales in New Zealand. How helpful is this? Well, not very! The wide confidence intervals in this estimate are problematic, and it is difficult to draw any conclusions when the range of possible numbers is so large. So stay tuned as I will be learning more about modeling population abundance estimates in order to provide a more precise and descriptive answer.

But stepping back for a minute, what does it matter how many whales there are and what they’re doing? In 2014, Leigh demonstrated that the STB is an important foraging ground for these blue whales. However, the STB is also a region heavily used by industry, experiencing active oil and gas extraction (Figure 3), seismic surveying, shipping traffic, and proposed seafloor mining. If we don’t know how the blue whales are using this space, then how can we know what effect the presence of industry will have on their ecology? It is our hope that findings from this study can guide effective conservation and management of these ocean giants as well as the ecosystem they are part of.

Figure 2. A blue whale surfaces in front of an oil rig in the South Taranaki Bight, New Zealand. Photo by Deanna Elvines.
Figure 3. A blue whale surfaces in front of an oil rig. Photo by Deanna Elvines.

Keeping these goals in mind, I’m eagerly awaiting the start of our 2017 field season in the STB. As I look through all these photos I feel like I’m getting to know this group of whales just a little bit and I look forward to being on the water seeing them myself, maybe even recognizing some from the 2016 photos. More time on the water and more data will bring us closer to the piecing together the story of these whales, and inevitably open doors to more questions than we started with. And in the meantime, I’m grateful for the community I’ve found here in the GEMM Lab, at Hatfield Marine Science Center, and in Newport.