Forecasting blue whale presence: Small steps toward big goals

By Dawn Barlow, MSc student, Department of Fisheries and Wildlife, Geospatial Ecology of Marine Megafauna Lab

In 2013, Leigh first published a hypothesis that the South Taranaki Bight region between New Zealand’s North and South Islands is important habitat for blue whales  (Torres 2013). Since then, we have collected three years of data and conducted dedicated analyses, so we now understand that a unique population of blue whales is found in New Zealand, and that they are present in the South Taranaki Bight year-round (Barlow et al. in press).

A blue whale surfaces in the South Taranaki Bight. Photo by Leigh Torres.

This research has garnered quite a bit of political and media attention. A major platform item for the New Zealand Green Party around the last election was the establishment of a marine mammal sanctuary in the South Taranaki Bight. When the world’s largest seismic survey vessel began surveying the South Taranaki Bight this summer for more oil and gas reserves using tremendously loud airguns, there were rallies on the lawn in front of Parliament featuring a large inflatable blue whale that the protesters affectionately refer to as “Janet”. Needless to say, blue whales have made their way into the spotlight in New Zealand.

Janet the inflatable blue whale accompanies protesters on the lawn in front of Parliament in Wellington, New Zealand. Image credit: Greenpeace.

Now that we know there is a unique population of blue whales in New Zealand, what is next? What’s next for me is an exciting combination of both ecology and conservation. If an effective sanctuary is to be implemented, it needs to be more than a simple box drawn on a map to check off a political agenda item—the sanctuary should be informed by our best ecological knowledge of the blue whales and their habitat.

In July, Leigh and I will attend the Society for Conservation Biology meeting in Wellington, New Zealand, and I’ll be giving a presentation titled “Cloudy with a chance of whales: Forecasting blue whale presence based on tiered, bottom-up models”. I’ll be the first to admit, I am not yet forecasting blue whale presence. But I am working my way there, step-by-step, through this tiered, bottom-up approach. In cetacean habitat modeling, we often assume that whale distribution on a foraging ground is determined by their prey’s distribution, and that satellite images of temperature and chlorophyll-a provide an accurate picture of what is going on below the surface. Is this true? With our three years of data including in situ oceanography, krill hydroacoustics, and blue whale distribution and behavior, we are in a unique position to test some of those assumptions, as well as provide managers with an informed management tool to predict blue whale distribution.

What questions will we ask using our data? Firstly, can in situ oceanography (i.e., thermocline depth and temperature, mixed layer depth) predict the distribution and density of blue whale prey (krill)? Then, can those prey patterns be accurately predicted in the absence of oceanographic measurements, using just satellite images? Next, we’ll bring the blue whales back into the picture to ask: can we predict blue whale distribution based on our in situ measurements of oceanography and prey? And finally, in the absence of in situ measurements (which is most often the case), can we forecast where the whales will be based just on remotely-sensed images of the region?

The transducer pole in the water off the RV Star Keys (left) deployed with the echosounder to collect prey availability data, including this image (right) of krill swarms near feeding blue whales. Photo by Leigh Torres.

So, cloudy with a chance of whales? Well, you’ll have to stay tuned for that story in the coming months. In the meantime, I can tell you that as daunting as it is to aggregate so many data streams, each step of the way has a piece of the story to tell. I can’t wait to see how it falls together, both from an ecological modeling perspective and a conservation management objective.

A blue whale surfaces in front of a floating production storage and offloading (FPSO) vessel which services the oil rigs in the South Taranaki Bight. Photo by Dawn Barlow.


References:

Torres, L. G. (2013). Evidence for an unrecognised blue whale foraging ground in New Zealand. New Zealand Journal of Marine and Freshwater Research47(2), 235-248.

Barlow, D. R., Torres, L. G., Hodge, K. B., Steel, D. Baker, C. S., Chandler, T. E., Bott, N., Constantine, R., Double, M. C., Gill, P., Glasgow, D., Hamner, R. M., Lilley, C., Ogle, M., Olson, P. A., Peters, C., Stockin, K. A., Tessaglia-Hymes, C. T., Klinck, H. (in press). Documentation of a New Zealand blue whale population based on multiple lines of evidence. Endangered Species Research. 

Living the Dream – life as a marine mammal observer

By Florence Sullivan, MSc.

Living the dream as a marine mammal observer onboard the R/V Bell Shimada Photo credit: Dave Jacobsen

I first learned that “Marine Mammal Observer” was a legitimate career field during the summer after my junior year at the University of Washington.  I had the good fortune to volunteer for the BASIS fisheries-oceanography survey onboard the R/V Oscar Dyson where I met two wonderful bird observers who taught me how to identify various pelagic bird species and clued me in to just how diverse the marine science job market can be. After the cruise, younger Florence went off with an expanded world view and a small dream that maybe someday she could go out to sea and survey for marine mammals on a regular basis (and get paid for it?!).  Eight years later, I am happy to report that I have just spent the last week as the marine mammal observer on the North California Current Survey on the Dyson’s sister ship, the R/V Bell M. Shimada.  While we may not have seen as many marine mammals as I would have liked, the experience has still been everything younger Florence hoped it would be.

Finally leaving port a few days behind schedule due to stormy weather! photo credit: Florence Sullivan

If you’ve ever wondered why the scientists in your life may refer to summer as “field work season”, it’s because attempting to do research outside in the winter is an exercise in frustration, troubleshooting, and flexibility. Case in point; this cruise was supposed to sail away from port on the 24th of February, but did not end up leaving until the 27th due to bad weather.  This weather delay meant that we had to cut some oceanographic stations we would like to have sampled, and even when we made it out of the harbor, the rough weather made it impossible to sample some of the stations we still had left on our map.  That being said, we still got a lot of good work done!

The original station map. The warm colors are the west coast of the US, the cold colors are the ocean, and the black dots are planned survey stations

The oceanographers were able to conduct CTD casts at most planned stations, as well as sample the water column with a vertical zooplankton net, a HAB net (for looking for the organisms that cause Harmful Algal Blooms),  and a Bongo Net (a net that specializes in getting horizontal samples of the water column).  When it wasn’t too windy, they were also able to sample with the Manta net (a net specialized for surface sampling – it looks like a manta ray’s mouth) and at certain near-shore stations they did manage to get some bottom beam trawls in to look at the benthic community of fishes and invertebrates.  All this was done while dodging multitudes of crab pots and storm fronts.  The NOAA corps officers who drive the boat, and the deck crew who handle all the equipment deployments and retrievals really did their utmost to make sure we were able to work.

Stormy seas make for difficult sampling conditions! photo credit: Florence Sullivan

For my part, I spent the hours between stations searching the wind-tossed waves for any sign of marine mammals. Over the course of the week, I saw a few Northern fur seals, half a dozen gray whales, and a couple of unidentified large cetaceans.  When you think about the productivity of the North Pacific Ecosystem this may not seem like very much.  But remember, it is late winter, and I do not have x-ray vision to see through the waves.  It is likely that I missed a number of animals simply because the swell was too large, and when we calculate our “detection probability” these weather factors will be taken into account. In addition, many of our local marine mammals are migrators who might be in warmer climates, or are off chasing different food sources at the moment.  In ecology, when you want to know how a population of animals is distributed across a land- or sea-scape, it is just as important to understand where the animals are NOT as where they ARE. So all of this “empty” water was very important to survey simply because it helps us refine our understanding of where animals don’t want to be.  When we know where animals AREN’T we can ask better questions about why they occur where they ARE.

Black Footed Albatross soars near the boat. Photo credit: Florence Sullivan

Notable species of the week aside from the marine mammals include Laysan and Black Footed Albatrosses, a host of Vellella vellella (sailor by the wind hydroid colonies) and the perennial favorite of oceanographers; the shrinking Styrofoam cup.  (See pictures)

We sent these styrofoam cups down to 1800 meters depth. The pressure at those depths causes all the air to escape from the styrofoam, and it shrinks! This is a favorite activity of oceanographers to demonstrate the effects on increased pressure!

These sorts of interdisciplinary cruises are quite fun and informative to participate in because we can build a better picture of the ecosystem as a whole when we use a multitude of methods to explore it.  This strength of cooperation makes me proud to add my little piece to the puzzle. As I move forward in life, whether I get to be the marine mammal observer, the oceanographer, or perhaps an educator, I will always be glad to contribute to collaborative research.


Exploring the Coral Sea in Search of Humpbacks

By: Solène Derville, Entropie Lab, Institute of Research for Development, Nouméa, New Caledonia (Ph.D. student under the co-supervision of Dr. Leigh Torres)

Once again the austral winter is ending, and with it ends the field season for the scientific team studying humpback whales in New Caledonia. Through my PhD, I have become as migratory as my study species so this is also the time for me to fly back to Oregon for an intense 3 months of data analysis at the GEMM Lab. But before packing, it is time for a sum-up!

In 2014, the government of New Caledonia has declared all waters of the Economic Exclusive Zone to be part of a giant marine protected area: the Natural Park of the Coral Sea. These waters are seasonally visited by a small and endangered population of humpback whales whose habitat use patterns are poorly known. Indeed, the park spans more than 1.3 million km2 and its most remote and pristine areas therefore remained pretty much unexplored in terms of cetacean presence… until recently.

In 2016, the project WHERE “Humpback Whale Habitat Exploration to improve spatial management in the natural park of the CoRal Sea” was launch by my PhD supervisor, Dr. Garrigue, and I, to conduct surveys in remote reefs, seamounts and shallow banks surrounding New Caledonia mainland. The aim of the project is to increase our understanding of habitat use and movements of humpback whales in breeding grounds over a large spatial scale and predict priority conservation areas for the park.

Fig. 1. A humpback whale with our research vessel, the oceanographic vessel Alis, in the background.

This season, three specific areas were targeted for survey during the MARACAS expeditions (Marine Mammals of the Coral Sea):

– Chesterfield and Bellona reefs that surround two huge 30- to 60m-deep plateaus and are located halfway between New Caledonia and Australia (Fig. 4). Considered as part of the most pristine reefs in the Coral Sea, these areas were actually identified as one of the main hotspots targeted by the 19th century commercial whaling of humpback whales in the South Pacific (Oremus and Garrigue 2014). Last year’s surveys revealed that humpback whales still visit the area, but the abundance of the population and its connection to the neighboring breeding grounds of New Caledonia and Australia is yet to establish.

Fig. 2. The tiny islands along the Chesterfield and Bellona reefs also happen to host nesting sites for several species of boobies and terns. Here, a red-footed booby (Sula sula).

– Walpole Island and Orne bank are part of the shallow areas East of the mainland of New Caledonia (Fig. 4), where several previously tagged whales were found to spend a significant amount of time. This area was explored by our survey team for the first time last year, revealing an unexpected density of humpback whales displaying signs of breeding (male songs, competitive groups) and nursing activity (females with their newborn calf).

Fig. 3. The beautiful cliffs of Walpole Island rising from the Pacific Ocean.

Antigonia seamount, an offshore breeding site located South of the mainland (Fig. 4) and known for its amazingly dense congregations of humpback whales.  The seamount rises from the abyssal seabed to a depth of 60 m, with no surfacing island or reef to shelter either the whales or the scientists from rough seas.

Fig. 4. Map of the New Caledonia Economic Exclusive Zone (EEZ) and the project WHERE study areas (MARACAS expeditions).

During our three cruises, we spent 37 days at-sea while a second team continued monitoring the South Lagoon breeding ground. Working with two teams at the same time, one covering the offshore breeding areas and the other monitoring the coastal long-term study site of the South Lagoon, allowed us to assess large scale movements of humpback whales within the breeding season using photo-ID matches. This piece of information is particularly important to managers, in order to efficiently protect whales both within their breeding spots, and the potential corridors between them.

So how would you study whales over such a large scale?

Well first, find a ship. A LARGE ship. It takes more than 48 hours to reach the Chesterfield reefs. The vessel needs to carry enough gas necessary to survey such an extensive region, plus the space for a dinghy big enough to conduct satellite tagging of whales. All of this could not have been possible without the Amborella, the New Caledonian governement’s vessel, and the Alis, a French oceanographic research vessel.

Second, a team needs to be multidisciplinary. Surveying remote waters is logistically challenging and financially costly, so we had to make it worth our time. This season, we combined 1) photo-identification and biopsy samplings to estimate population connectivity, 2) acoustic monitoring using moored hydrophone (one of which recorded in Antigonia for more than two months, Fig. 5), 3) transect lines to record encounter rates of humpback whales, 4) in situ oceanographic measurements, and finally 5) satellite tracking of whales using the recent SPLASH10 tags (Wildlife Computers) capable of recording dive depths in addition to geographic positions (Fig. 6).

Fig. 5. Claire, Romain and Christophe standing next to our moored hydrophone, ready for immersion.

Satellite tracks and photo-identification have already revealed some interesting results in terms of connectivity within the park and with neighboring wintering grounds.

Preliminary matching of the caudal fluke pictures captured this season and in 2016 with existing catalogues showed that the same individuals may be resighted in different regions of the Park. For instance, some of the individuals photographed in Chesterfield – Bellona, had been observed around New Caledonia mainland in previous years! This match strengthens our hypothesis of a connection between Chesterfield reef complex and New Caledonia.

Yet, because the study of whale behavior is never straightforward, one tagged whale also indicated a potential connection between Chesterfield-Bellona and Australia East coast (Fig. 6). This is the first time a humpback whale is tracked moving between New Caledonia and East Australia within a breeding season. Previous matches of fluke catalogues had shown a few exchanges between these two areas but these comparisons did not include Chesterfield. Is it possible that the Chesterfield-Bellona coral reef complex form a connecting platform between Australia and New Caledonia? The matching of our photos with those captured by our Australian colleagues who collected data at the Great Barrier Reef  in 2016 and 2017 should help answer this question…

Fig. 6. “Splash” was tagged in Chesterfield in August and after spending some time in Bellona it initiated a migration south. Seamounts seem to play an important role for humpback whales in the region, as “Splash” stopped on Kelso and Capel seamount during its trip. It reached the Australian coast a couple of days ago and we are looking forward to discover the rest of its route!

While humpback whales often appear like one of the most well documented cetacean species, it seems that there is yet a lot to discover about them!

Acknowledgements:

These expeditions would not have been possible without the financial and technical support of the French Institute of Research for Development, the New Caledonian government, the French  Ministère de la Transition Ecologique et Solidaire, and the World Wide Fund for Nature. And of course, many thanks to the Alis and Amborella crews, and to our great fieldwork teammates: Jennifer Allen, Claire Bonneville, Hugo Bourgogne, Guillaume Chero, Rémi Dodémont, Claire Garrigue, Nicolas Job, Romain Le Gendre, Marc Oremus, Véronique Pérard, Leena Riekkola, and Mike Williamson.

Fig. 7A. The teams of the three 2017 MARACAS expeditions (Marine Mammals of the Coral Sea).
Fig. 7B. The teams of the three 2017 MARACAS expeditions (Marine Mammals of the Coral Sea).
Fig. 7C. The teams of the three 2017 MARACAS expeditions (Marine Mammals of the Coral Sea).

Finding the edge: Preliminary insights into blue whale habitat selection in New Zealand

By Dawn Barlow, MSc student, OSU Department of Fisheries and Wildlife, Geospatial Ecology of Marine Megafauna Lab

I was fortunate enough to spend the Austral summer in the field, and so while the winter rain poured down on Oregon I found myself on the water with the sun and wind on my face, looking for blue whales in New Zealand. This spring I switched gears and spent time taking courses to build my analytical toolbox. In a course on technical writing and communication, I was challenged to present my research using only pictures and words with no written text, and to succinctly summarize the importance of my research in an introduction to a technical paper. I attended weekly seminars to learn about the diverse array of marine science being conducted at Oregon State University and beyond. I also took a course entitled “Advanced Spatial Statistics and Geographic Information Science”. In this skill-building course, we were given the opportunity to work with our own data. Even though my primary objective was to expand the tools in my toolbox, I was excited to explore preliminary results and possible insight into blue whale habitat selection in my study area, the South Taranaki Bight region (STB) of New Zealand (Figure 1).

Figure 1. A map of New Zealand, with the South Taranaki Bight (STB) region delineated by the black box. Farewell Spit is denoted by a star, and Kahurangi point is denoted by an X.

Despite the recent documentation of a foraging ground in the STB, blue whale distribution remains poorly understood in New Zealand. The STB is New Zealand’s most industrially active marine region, and the site of active oil and gas extraction and exploration, busy shipping traffic, and proposed seabed mining. This potential space-use conflict between endangered whales and industry warrants further investigation into the spatial and temporal extent of blue whale habitat in the region. One of my research objectives is to investigate the relationship between blue whales and their environment, and ultimately to build a model that can predict blue whale presence based on physical and biological oceanographic features. For this spring term, the question I asked was:

Is the number of blue whales present in an area correlated with remotely-sensed sea surface temperature and chlorophyll-a concentration?

For the purposes of this exploration, I used data from our 2017 survey of the STB. This meant importing our ship’s track and our blue whale sighting locations into ArcGIS, so that the data went from looking like this:

… to this:

The next step was to get remote-sensed images for sea surface temperature (SST) and chlorophyll-a (chl-a) concentration. I downloaded monthly averages from the NASA Moderate Resolution Imaging Spectrometer (MODIS aqua) website for the month of February 2017 at 4 km2 resolution, when our survey took place. Now, my images looked something more like this:

But, I can’t say anything reliable about the relationships between blue whales and their environment in the places we did not survey.  So next I extracted just the portions of my remote-sensed images where we conducted survey effort. Now my maps looked more like this one:

The above map shows SST along our ship’s track, and the locations where we found whales. Just looking at this plot, it seems like the blue whales were observed in both warmer and colder waters, not exclusively in one or the other. There is a productive plume of cold, upwelled water in the STB that is generated off of Kahurangi point and curves around Farewell Spit and into the bight (Figure 1). Most of the whales we saw appear to be near that plume. But how can I find the edges of this upwelled plume? Well, I can look at the amount of change in SST and chl-a across a spatial area. The places where warm and cold water meet can be found by assessing the amount of variability—the standard deviation—in the temperature of the water. In ArcGIS, I calculated the deviation in SST and chl-a concentration across the surrounding 20 km2 for each 4 km2 cell.

Now, how do I tie all of these qualitative visual assessments together to produce a quantitative result? With a statistical model! This next step gives me the opportunity to flex some other analytical muscles, and practice using another computational tool: R. I used a generalized additive model (GAM) to investigate the relationships between the number of blue whales observed in each 4 km2 cell our ship surveyed and the remote-sensed variables. The model can be written like this:

Number of blue whales ~ SST + chl-a + sd(SST) + sd(chl-a)

In other words, are SST, chl-a concentration, deviation in SST, and deviation in chl-a concentration correlated with the number of blue whales observed within each 4 km2 cell on my map?

This model found that the most important predictor was the deviation in SST. In other words, these New Zealand blue whales may be seeking the edges of the upwelling plume, honing in on places where warm and cold water meet. Thinking back on the time I spent in the field, we often saw feeding blue whales diving along lines of mixing water masses where the water column was filled with aggregations of krill, blue whale prey. Studies of marine mammals in other parts of the world have also found that eddies and oceanic fronts—edges between warm and cold water masses—are important habitat features where productivity is increased due to mixing of water masses. The same may be true for these New Zealand blue whales.

These preliminary findings emphasize the benefit of having both presence and absence data. The analysis I have presented here is certainly strengthened by having environmental measurements for locations where we did not see whales. This is comforting, considering the feelings of impatience generated by days on the water spent like this with no whales to be seen:

Moving forward, I will include the blue whale sighting data from our 2014 and 2016 surveys as well. As I think about what would make this model more robust, it would be interesting to see if the patterns become clearer when I incorporate behavior into the model—if I look at whales that are foraging and traveling separately, are the results different? I hope to explore the importance of the upwelling plume in more detail—does the distance from the edge of the upwelling plume matter? And finally, I want to adjust the spatial and temporal scales of my analysis—do patterns shift or become clearer if I don’t use monthly averages, or if I change the grid cell sizes on my maps?

I feel more confident in my growing toolbox, and look forward to improving this model in the coming months! Stay tuned.

Celebrating Hydrothermal Vents!

By Florence Sullivan, MSc Student OSU

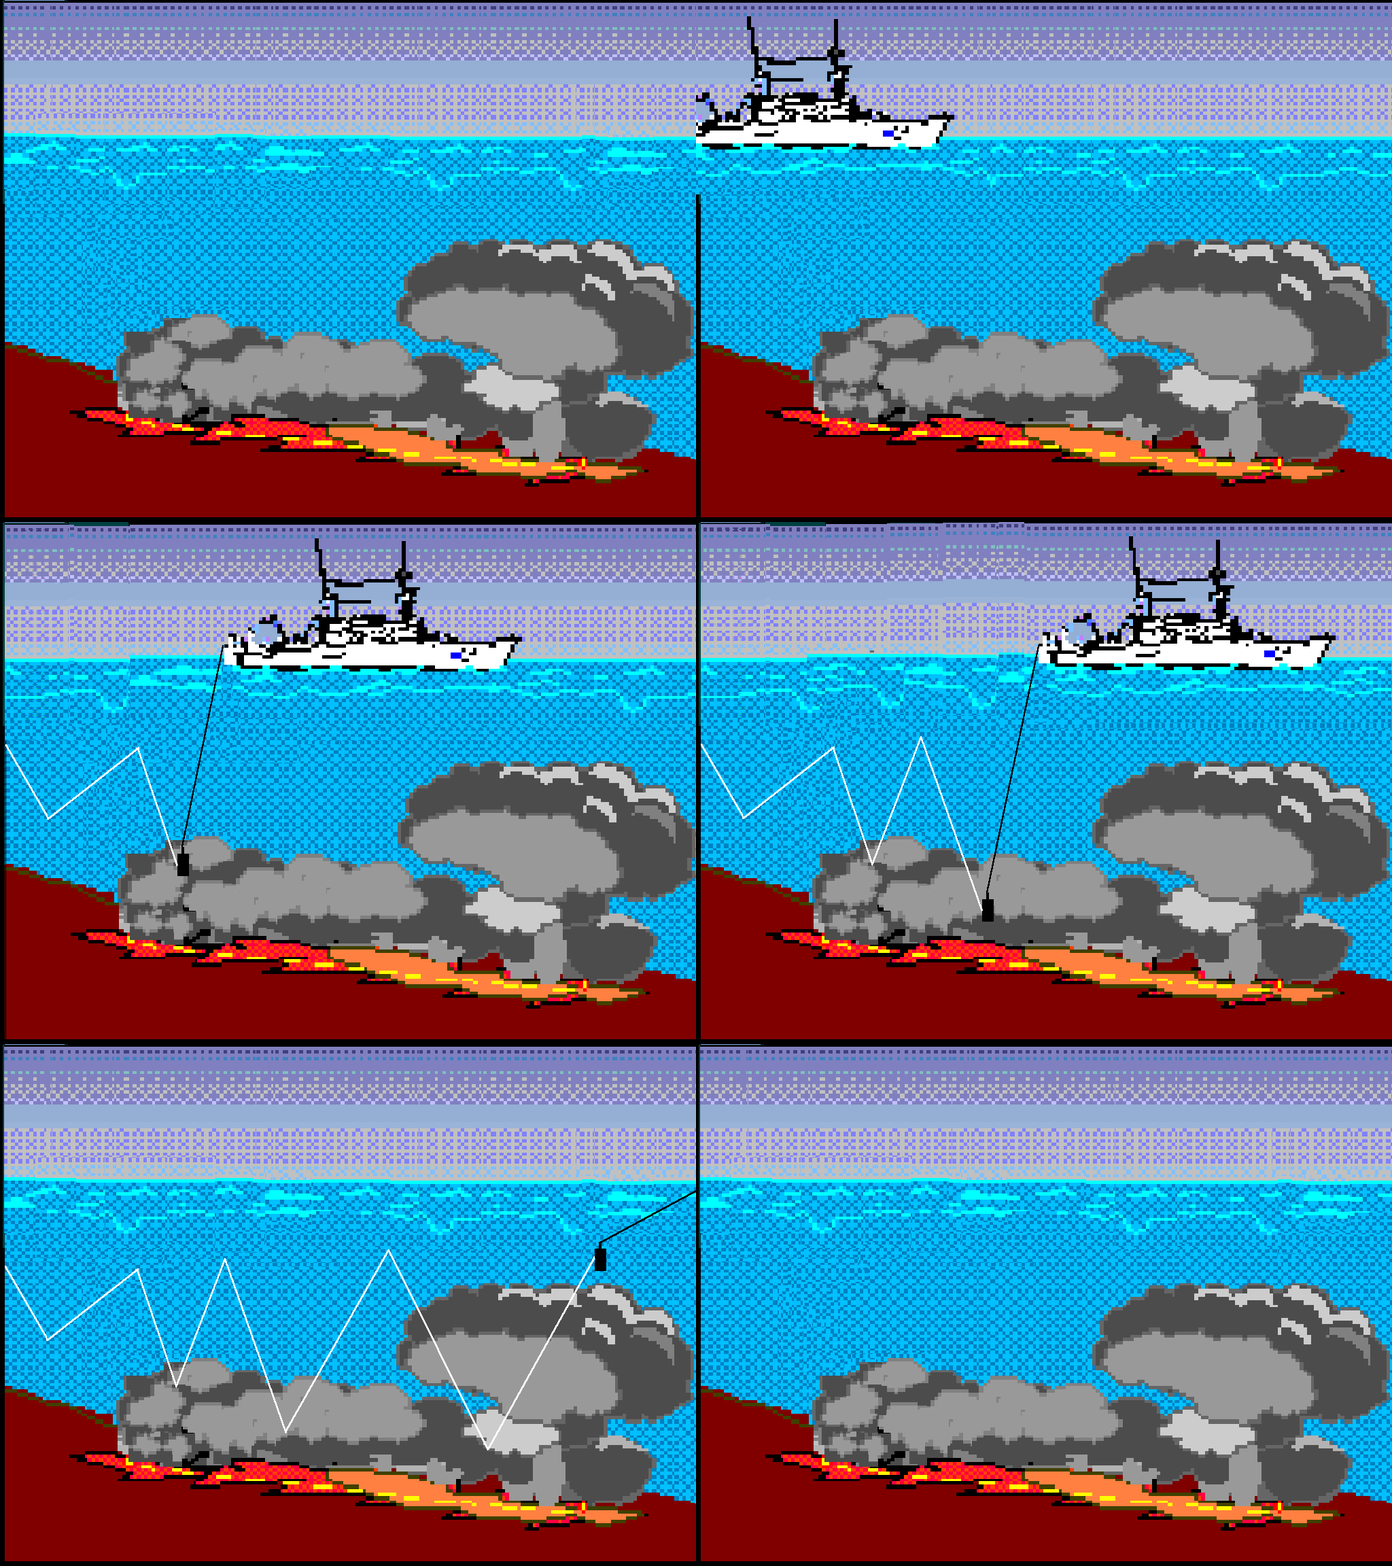
40 years ago, in 1977 OSU researchers led an NSF funded expedition to the Galapagos on a hunt for suspected hydrothermal vents. From the 1960s to the mid-1970s, mounting evidence such as (1) temperature anomalies found deep in the water column, (2) conduction heat flow probes at mid ocean ridges recording temperatures much lower than expected, (3) unusual mounds found on benthic mapping surveys, and (4) frequent, small, localized earthquakes at mid oceanic ridges, had the oceanographic community suspecting the existence of deep sea hydrothermal vents. However, until the 1977 cruise, no one had conclusive evidence that they existed.  During the discovery cruise at the Galapagos rift, the PI (principle investigator), Dr. Jack Corliss from OSU, used tow-yos (a technique where you drag a CTD up and down through the water in a zig zag pattern – see gif) to pinpoint the location of the hydrothermal vent plume. The team then sent the Deep Submergence Vehicle (DSV) Alvin to investigate and returned with the first photographs and samples from a hydrothermal vent. While discovery of the vent systems helped answer many questions about chemical and heat fluxes in the deep sea, it generated so many new questions that novel fields of study were created in biology, microbiology, marine chemistry, marine geology, planetary science, astrobiology and the study of the origin of life.

 “Literally every organism that came up was something that was unknown to science up until that time. It made it terribly exciting. Anything that came [up] on that basket was a new discovery,” – Dr. Richard Lutz (Rutgers University)

In celebration of this great discovery, OSU’s College of Earth, Ocean and Atmospheric Sciences sponsored a seminar looking at the past, present, and future of hydrothermal vent sciences. Dr. Robert Collier began with a timeline of how the search for hydrothermal vents began, and a commemoration of all the excellent researchers and collaborations between institutions and agencies that made the discovery possible. He acknowledged that such collaborations are often somewhat tense in terms of who gets credit for which discovery, and that while Oregon State University was the lead of the project, it takes a team to get the work done.  Dr. Jack Corliss proudly followed up with a wonderful rambling explanation of how vent systems work, and a brief dip into his ground breaking paper, “An Hypothesis concerning the relationship between submarine hot springs and the origin of life on Earth.” Published in 1981, with co-authors Dr. John Baross and Dr. Sarah Hoffman, they postulate that the temperature and chemical gradients seen at hydrothermal vents provide pathways for the synthesis of chemical compounds, formation and evolution of ‘precells’ and eventually, the evolution of free living organisms.

Dr. Corliss, Dr. Baross, and Dr. Hoffman were the first to suggest the now popular theory of the origin of life at hydrothermal vents. (click on image to read full paper)

Because of time constraints, the podium was swiftly handed over to Dr. Bill Chadwick (NOAA PMEL/ HMSC CIMRS) who brought us forward to the present day with an exciting overview of current vent research.  He began by saying “at the beginning, we thought, ‘No one has seen one of these systems before, they must be very rare…’ Now, we have found them [hydrothermal vents] in every ocean basin – including the arctic and southern oceans. We just needed to know how to look!”  Dr. Chadwick also reminded us that even 40 years later, new discoveries are still being made. For example, on his most recent cruise aboard the R/V Falkor in December 2016, they found a sulfur chimney that was alternately releasing bubbles of gas (sulfur, CO2 or other, hard to know without sampling) or bubbles of liquid sulfur! Check out the video below:

Some of the goals for this recent cruise included mapping new areas of the Mariana back-arc, and investigating differences in the biological communities between vents in the Mariana trench region (a subduction zone) and vents in the back arc (a spreading zone) to see if geology plays a role in biological community composition.  For some very cool video footage of the expedition and the various dives performed by the brand new ROV SUBastian (because all scientists love puns), check out the Schmidt Ocean Institute youtube channel.

Dr. Chadwick showed this video to highlight results from his last cruise.

Finally, Dr. Andrew Thurber wrapped up the session with some thoughts about hydrothermal vents from the perspective of an ecosystem services model. Even after 40 years of research, there are still many unknowns about these ecosystems.  Individual vent systems are inherently unique due to their deep sea isolation. However, most explored sites have revealed metals and mineral deposits that have generated a lot of interest from commercial sea floor mining companies. Exploitation of these deposits would be an example of ecosystem “provisioning services” (products that are obtained from the ecosystem). Other examples include the biology of the vents as a source of new genetic material, and the thermal and chemical gradients as natural laboratories that could lead to breakthroughs in pharmaceutical research. Cultural services are those non-material benefits that people obtain from an ecosystem. At hydrothermal vents these include new scientific discoveries, educational uses (British children’s television show “The Octonauts,” has several episodes featuring hydrothermal vent creatures), and creative inspiration for artists and others. Dr. Thurber cautions that there are ethical questions to be answered before considering exploitation of these resources, but there is a lot of potential for commercial and non-commercial use of vent ecosystems.

Vent inspired art by Lily Simonson

As an undergraduate at the University of Washington, I spent time as a research assistant in Dr. John Baross’ astrobiology lab. We studied evolutionary pathways of hydrothermal vent viruses and bacteria to inform the search for life on exoplanets such as Jupiter’s moon Europa.  It was very fun and exciting for me to attend this seminar, hear stories from pioneers in the field, and remember the systems I worked on in undergrad.  I may have moved up the food chain a little now, but as we all work on our pieces of the puzzle, it is important for scientists to remember the interdisciplinary nature of our work, and how there is always something more to learn.


Keeping up with blue whales in a dynamic environment

By Dawn Barlow, MSc student, Department of Fisheries and Wildlife, Geospatial Ecology of Marine Megafauna Lab

“The marine environment is patchy and dynamic”. This is a phrase I have heard, read, and written repeatedly in my studies of marine ecology, and it has become increasingly tangible during the past several weeks of fieldwork. The presence of the blue whales we’ve come here to study is the culmination of a chain of events that begins with the wind. As we huddle up at anchor or in port while the winds blow through the South Taranaki Bight, the water gets mixed and our satellite images show blooms of little phytoplankton lifeforms. These little phytoplankton provide food for the krill, the main prey item of far larger animals—blue whales. And in this dynamic environment, nothing stays the same for long. As the winds change, aggregations of phytoplankton, krill and whales shift.

When you spend hours and hours scanning for blue whales, you also grow intimately familiar with everything that could possibly look like a blue whale but is not. Teasers include whitecaps, little clouds on the horizon, albatrosses changing flight direction, streaks on your sunglasses, and floating logs. Let me tell you, if we came here to study logs we would have quite the comprehensive dataset! We have had a few days of long hours with good weather conditions and no whales, and it is difficult not to be frustrated at those times—we came here to find whales. But the whale-less days prompt musings of what drives blue whale distribution, foraging energetics, and dreams of elaborate future studies and analyses, along with a whole lot of wishing for whales. Because, let’s admit it, presence data is just more fun to collect.

The view from the flying bridge of R/V Star Keys of Mt. Taranaki and a calm sea with no whales in sight. Photo by D. Barlow.

But we’ve also had survey days filled with so many whales that I can barely keep track of all of them. When as soon as we begin to head in the direction of one whale, we spot three more in the immediate area. Excited shouts of “UP!! Two o’clock at 300 meters!” “What are your frame numbers for your right side photos?” “Let’s come 25 degrees to port” “UUUPPP!! Off the bow!” “POOOOOOP! Grab the net!!” fill the flying bridge as the team springs into action. We’ve now spotted 40 blue whales, collected 8 biopsy samples, 8 fecal samples, flown the drone over 9 whales, and taken 4,651 photographs. And we still have more survey days ahead of us!

A blue whale surfaces just off the bow of R/V Star Keys. Photo by D. Barlow.

In Leigh’s most recent blog post she described our multi-faceted fieldwork here in the South Taranaki Bight. Having a small inflatable skiff has allowed for close approaches to the whales for photo-identification and biopsy sample collection while our larger research vessel collects important oceanographic data concurrently. I’ve been reading numerous papers linking the distribution of large marine animals such as whales with oceanographic features such as fronts, temperature, and primary productivity. In one particular sighting, the R/V Star Keys idled in the midst of a group of ~13 blue whales, and I could see foamy lines on the surface where water masses met and mixed. The whales were diving deep—flukes the size of a mid-sized car gracefully lifting out of the water. I looked at the screen of the echosounder as it pinged away, bouncing off a dense layer of krill (blue whale prey) just above the seafloor at around 100 meters water depth.  As I took in the scene from the flying bridge, I could picture these big whales diving down to that krill layer and lunge feeding, gorging themselves in these cool, productive waters. It is all mostly speculative at this point and lots of data analysis time remains, but ideas are cultivated and validated when you experience your data firsthand.

A blue whale shows its fluke as it dives deep in an area with abundant krill deep in the water column. Photo by L. Torres.

The days filled with whales make the days without whales worthwhile and valuable. To emphasize the dynamic nature of the environment we study, when we returned to an area in which we had seen heaps of whales just 12 hours before, we only found glassy smooth water and no whales whatsoever. Changing our trajectory, we came across nothing for the first half of the day and then one pair of whales after another. Some traveling, some feeding, and two mother-calf pairs.

The dynamic nature of the marine environment and the high mobility of our study species is what makes this work challenging, frustrating, exciting, and fascinating. Now we’re ready to take advantage of our next weather window to continue our survey effort and build our ever-growing dataset. I relish the wind-swept, sunburnt days of scanning and musing, and I also look forward to settling down with all of these data to try my best to compile all of the pieces of this blue whale puzzle. And I know that when I find myself behind a computer screen processing and analyzing photos, survey effort, drone footage, and oceanographic data I will be imagining the blue waters of the South Taranaki Bight, the excitement of seeing the water glow brilliantly just before a whale surfaces off our bow, and whale-filled survey days that end only when the sun sets over the water.

A big moon rises to the east and a bright oil rig on the horizon at the end of a long and fruitful survey day. Photo by L. Torres.
And to the west of the moon and the rig, the sun sets over the South Taranaki Bight. Photo by L. Torres.


I love it when a plan comes together

By Dr. Leigh Torres

GEMM Lab

After four full-on days at sea covering 873 nautical miles, we are back in port as the winds begin to howl again and I now sip my coffee with a much appreciated still horizon. Our dedicated team worked the available weather windows hard and it paid off with more great absence data and excellent presence data too: blue whales, killer whales, common dolphins, and happily swimming pilot whales not headed to nearby Farewell Spit where a sad, massive stranding has occurred. It has been an exhausting, exhilarating, frustrating, exciting, and fulfilling time. As I reflect on all this work and reward, I can’t help but feel gratified for our persistent and focused planning that made it happen successfully. So, as we clean-up, organize data, process samples, and sit in port for a few days I would like to share some of our highlights over the past four days. I hope you enjoy them as much as we did.

The team in action on the RV Star Keys. Callum Lilley (DOC) on the bow waiting for a biopsy opportunity, Dawn Barlow (OSU) on the radio communicating with the small boat, Kristin Hodge (Cornell) taking photos of whales, Captain James Dalzell (Western Work Boats) on the helm, and Chief Engineer Spock (Western Work Boats) keeping his eyes peeled for a blow. (Photo credit: L. Torres)


In the small boat off looking for whales in a lovely flat, calm sea with an oil rig in the background. (Photo credit: D. Barlow)


Small boat action with Todd Chandler (OSU) at the helm, Leigh Torres (OSU) on the camera getting photo-id images, and Callum Lilley (DOC) taking the biopsy shot, and the dart is visible flying toward the whale in the black circle. (Photo credit: D. Barlow)


The stars of the show: blue whales. A photograph captured from the small boat of one animal fluking up to dive down as another whale surfaces close by. (Photo credit: L. Torres)


Collecting oceanographic data: Spock and Jason (Western Work Boats) deploy the CTD from the Star Keys. The CTD is an instrument that measures temperature, salinity, fluorescence and depth continuously as it descends to the bottom and back up again. (Photo credit: L. Torres)


The recently manufactured transducer pole in the water off the RV Star Keys (left) deployed with the echosounder to collect prey availability data, including this image (right) of krill swarms near feeding blue whales. (Photo credit: L. Torres)


The small boat returns to the Star Keys loaded with data and samples, including a large fecal sample in the net: The pooper scooper Leigh Torres (OSU), the biopsy rifle expert Callum Lilley (DOC), and the boat operator Todd Chandler (OSU). (Photo credit: D. Barlow)


Drone operator and videographer, Todd Chandler (OSU) under the towel (crucial piece of gear) to minimize glare on the screen as he locates and records blue whales. (Photo credit: K. Hodge)


A still shot captured from the drone footage of two adult blue whales surfacing in close proximity. (Photo credit: T. Chandler)


The team in action looking for blue whales in ideal survey conditions with Mt. Taranaki in the background. Todd Chandler (OSU) enters survey data while Dawn Barlow (OSU) spies for whale blows. (Photo credit: L. Torres)


A late evening at-sea after a big day sees Callum Lilley (DOC) processing a blue whale biopsy sample for transport, storage and analysis. (Photo credit: K. Hodge)


And we can’t forget why so many have put time, money and effort into this project: These blue whales are feeding and living within a space exploited by humans for multiple purposes, so we must ensure minimal impacts to these whales and their sustained health. (Photo credit: D. Barlow)

The worst summer ever!

By Dr. Leigh Torres

Geospatial Ecology of Marine Megafauna Lab

“This is the worst summer ever in New Zealand.” During our four days of prep in Wellington before heading off on our vessel, almost all my friends and colleagues I spoke to said this statement (often with added emphasis). It’s been cold and windy here all summer long, and when the weather has cleared it has brought only brief respite. These comments don’t bode well for our blue whale survey dependent on calm survey conditions, but February is typically the prime month for good weather in New Zealand so I’m holding out hope. And this unpredictable weather is the common denominator of all field work. Despite months (years?) of preparation, with minute attention to all sort of details (e.g., poop net handle length, bag size limits, length of deployment lines), one of the most important factors to success is something we have absolutely no control over: the weather.

After just one day on the water, I can see that the oceanographic conditions this year are nothing like the hot-water El Niño conditions we experienced last summer. Surface water temperatures today ranged between 12.8 and 13.6 ⁰C. These temps are 10 degrees (Celsius) cooler than the 22 ⁰C water we often surveyed last summer. 10 degrees! Additionally, the current windy conditions have stirred up the upper portion of the ocean water column causing the productive mixed layer to be much deeper (therefore larger) than last year. While Kiwis may complain about the ‘terrible’ weather this summer, the resulting cold and productive oceanographic conditions are likely preferable for the whales. But where are the whales and can we find them with all this wind?

Today we had a pocket of calm conditions so our dedicated research team and crew hit it with enthusiasm, and collected a whole lot of great absence data. “Absence data?” you may ask. Absence data is all the information about where the whales are not, and is just as important as presence data (information about where the whales are) because it’s the comparison between the two sets of data (Presence vs Absence) that allows us to describe an animal’s “habitat use patterns”. Today we surveyed a small portion of the South Taranaki Bight for blue whales for about 6 hours, but the only blue animals we saw were little blue penguins and a blue shark (plus fur seals, dolphins, albatrosses, shearwaters, gannets, prions, kahawai, and saury).  But during this survey effort we collected a lot of synoptic environmental data to describe these habitats, including continuous depth and temperature data along our track, nine CTD water column profiles of temperature, salinity and florescence (productivity) from the surface to the seafloor, and continuous prey (zooplankton) availability data with our transducer (echosounder).

So, now that we have absence data, we need presence data. But, the winds are howling again and are predicted to continue for the next few days. As we hunker down in a beautiful protected cove I know the blue whales continue to search this region for dense food patches, unencumbered by human-perceived obstacles of high wind and swell. So, while my Kiwi friends are right – this summer is not like previous years – I also know that it is the effects of these dynamic weather patterns that we have come so far, and worked so hard, to study. Even as my patience wears thin and my frustrations mount, I will continue to wait to pounce on the right weather window to collect our needed presence data (and more absence data too, I’m sure).

Our research team collecting absence data aboard the RV Star Keys:

Oceanus Day Three: Dolphin Delights

by Florence Sullivan, MSc student

Our third day aboard the Oceanus began in the misty morning fog before the sun even rose. We took the first CTD cast of the day at 0630am because the physical properties of the water column do not change much with the arrival of daylight. Our ability to visually detect marine mammals, however, is vastly improved with a little sunlight, and we wanted to make the best use of our hours at sea possible.

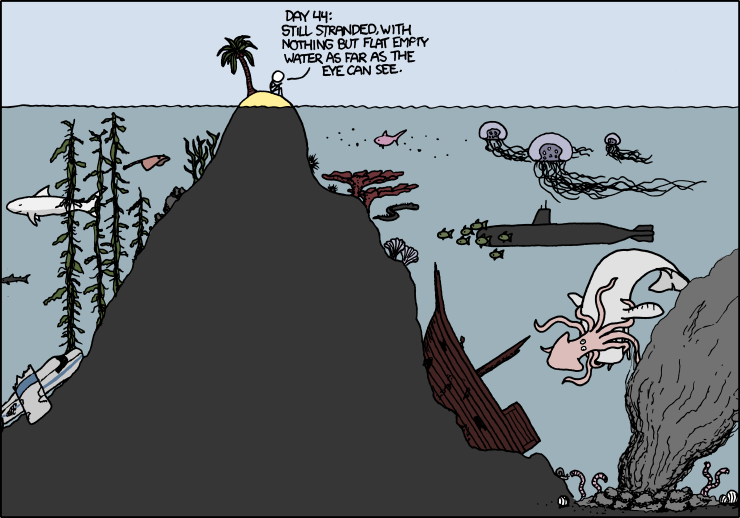
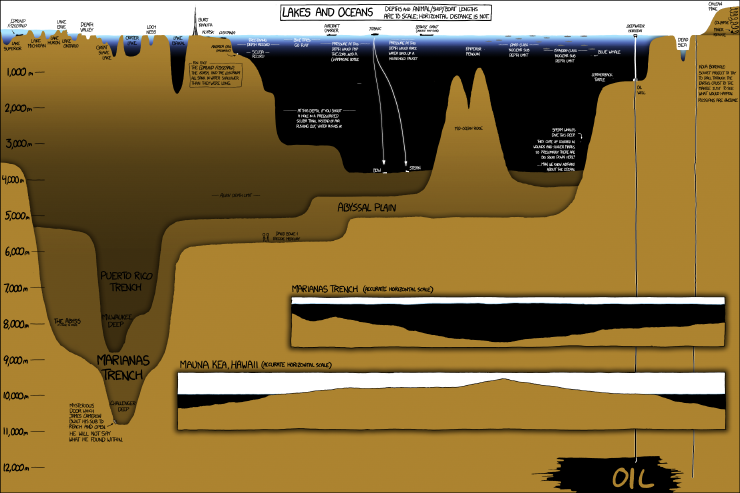
Randall Munroe www.XKCD.com

Our focus on day three was the Astoria canyon – a submarine feature just off the Oregon and Washington coast. Our first oceanographic station was 40 miles offshore, and 1300 meters deep, while the second was 20 miles offshore and only 170 meters deep.  See the handy infographic below to get a perspective on what those depths mean in the grand scheme of things.  From an oceanographic perspective, the neatest finding of the day was our ability to detect the freshwater plume coming from the Columbia River at both those stations despite their distance from each other, and from shore! Water density is one of the key characteristics that oceanographers use to track parcels of water as they travel through the ocean conveyor belt. Certain bodies of water (like the Mediterranean Sea, or the Atlantic or Pacific Oceans) have distinct properties that allow us to recognize them easily. In this case, it was very exciting to “sea” the two-layer system we had gotten used to observing overlain with a freshwater lens of much lower salinity, higher temperature, and lower density. This combination of freshwater, saltwater, and intriguing bathymetric features can lead to interesting foraging opportunities for marine megafauna – so, what did we find out there?

Click through link for better resolution: Randall Munroe www.XKCD.com/1040/large

Morning conditions were almost perfect for marine mammal observations – glassy calm with low swell, good, high, cloud cover to minimize glare and allow us to catch the barest hint of a blow….. it should come as no surprise then, that the first sightings of the day were seabirds and tuna!

I didn't catch any photos of the Tuna, so here's some mola mola we spotted. photo credit: Florence Sullivan
I didn’t catch any photos of the tuna, so here’s some sunfish we spotted. photo credit: Florence Sullivan

One of the best things about being at sea is the ability to look out at the horizon and have nothing but water staring back at you. It really drives home all the old seafaring superstitions about sailing off the edge of the world.  This close to shore, and in such productive waters, it is rare to find yourself truly alone, so when we spot a fishing trawler, there’s already a space to note it in the data log.  Ships at sea often have “follower” birds – avians attracted by easy meals as food scraps are dumped overboard. Fishing boats usually attract a lot of birds as fish bycatch and processing leftovers are flushed from the deck.  The birders groan, because identification and counts of individuals get more and more complicated as we approach other vessels.  The most thrilling bird sighting of the day for me were the flocks of a couple hundred fork-tailed storm petrels.

Fork-tailed storm petrels
Fork-tailed storm petrels. photo credit: Florence Sullivan

I find it remarkable that such small birds are capable of spending 80% of their life on the open ocean, returning to land only to mate and raise a chick. Their nesting strategy is pretty fascinating too – in bad foraging years, the chick is capable of surviving for several days without food by going into a state of torpor. (This slows metabolism and reduces growth until an adult returns.)

Just because the bird observers were starting to feel slightly overwhelmed, doesn’t mean that the marine mammal observers stopped their own survey.  The effort soon paid off with shouts of “Wait! What are those splashes over there?!” That’s the signal for everyone to get their binoculars up, start counting individuals, and making note of identifying features like color, shape of dorsal fin, and swimming style so that we can make an accurate species ID. The first sighting, though common in the area, was a new species for me – Pacific white sided dolphins!

Pacific white sided dolphin
A Pacific white sided dolphin leaps into view. photo credit: Florence Sullivan. Taken under NMFS permit 16111 John Calambokidis

A pod of thirty or so came to ride our bow wake for a bit, which was a real treat. But wait, it got better! Shortly afterward, we spotted more activity off the starboard bow.  It was confusing at first because we could clearly see a lot of splashes indicating many individuals, but no one had glimpsed any fins to help us figure out the species. As the pod got closer, Leigh shouted “Lissodelphis! They’re lissodelphis!”  We couldn’t see any dorsal fins, because northern right whale dolphins haven’t got one! Then the fly bridge became absolute madness as we all attempted to count how many individuals were in the pod, as well as take pictures for photo ID. It got even more complicated when some more pacific white sided dolphins showed up to join in the bow-riding fun.

Northern right whale dolphins are hard to spot! photo credit: Florence Sullivan Taken under NMFS permit 16111 John Calambokidis

All told, our best estimates counted about 200 individuals around us in that moment. The dolphins tired of us soon, and things continued to calm down as we moved further away from the fishing vessels.  We had a final encounter with an enthusiastic young humpback who was breaching and tail-slapping all over the place before ending our survey and heading towards Astoria to make our dock time.

Humpback whale breach
Humpback whale breach. photo credit: Florence Sullivan. Taken under NMFS permit 16111 John Calambokidis

As a Washington native who has always been interested in a maritime career, I grew up on stories of The Graveyard of the Pacific, and how difficult the crossing of the Columbia River Bar can be. Many harbors have dedicated captains to guide large ships into the port docks.  Did you know the same is true of the Columbia River Bar?  Conditions change so rapidly here, the shifting sands of the river mouth make it necessary for large ships to receive a local guest pilot (often via helicopter) to guide them across.  The National Motor Lifeboat School trains its students at the mouth of the river because it provides some of “the harshest maritime weather conditions in the world”.  Suffice it to say, not only was I thrilled to be able to detect the Columbia River plume in our CTD profile, I was also supremely excited to finally sail across the bar.  While a tiny part of me had hoped for a slightly more arduous crossing (to live up to all the stories you know), I am happy to report that we had glorious, calm, sunny conditions, which allowed us all to thoroughly enjoy the view from the fly bridge.

Cape Disappointment Lighthouse at the Columbia River Bar.

Finally, we arrived in Astoria, loaded all our gear into the ship’s RHIB (Ridged Hulled Inflatable Boat), lowered it into the river, descended the rope ladder, got settled, and motored into port. We waved goodbye to the R/V Oceanus, and hope to conduct another STEM cruise aboard her again soon.

Now if the ground would stop rolling, that would be just swell.

Last but not least, here are the videos we promised you in Oceanus Day Two – the first video shows the humpback lunge feeding behavior, while the second shows tail slapping. Follow our youtube channel for more cool videos!


Oceanus Day Two: All the Albatrosses

By Amanda Holdman and Florence Sullivan

Today got off to a bright and early start. As soon as daylight permitted, we had spotters out on duty looking for more marine mammals. We began to survey at the north end of Heceta bank, where we again encountered many humpback whales lunge feeding. We broke transect, and got some great video footage of a pair them – so check our youtube channel next week – we’ll upload the video as soon as we get back to better internet (dial up takes some getting used to again – the whales don’t know about highspeed yet).

Humpbacks lunge feeding at surface. photo credit: Leigh Torres. Taken under NMFS permit 16111 John Calambokidis.

After working with the humpbacks to capture photo-id data for about an hour, we turned south, and ran parallel to Heceta bank until we reached the southern edge. Along the way, we counted 30 humpbacks, and many California gulls, marbled murrelets, pink footed shearwaters, and sooty shearwaters.

After lunch, we conducted a CTD cast to see how conditions might be different between the southern and northern edges of the bank. Surface temperatures increased from 12.09C to 13.2C while bottom temperatures decreased from 8.7C to 7.8C.  The northern station was a textbook perfect two layer system. It had a well mixed surface layer with a steep pycnocline separating it from the colder, saltier, denser, bottom layer. The southern station still had two layers, but the pycnocline (the depth where a rapid change in density occurs, which delineates the edges of water masses) was not as steep. We are interested in these discreet measurements of ocean conditions because areas of high primary productivity (the green chlorophyll-a line) are often re-occurring hot spots of food for many levels of the food chain. Since we can’t phone the whales and ask them where to meet up, we use clues like these to anticipate the best place to start looking.

Readout of the CTD cast. The left plot has temperature in blue, and salinity in green. The right plot has density in black, chlorophyll-a in green, and oxygen in blue. observe how different variables change with depth!
Readout of the CTD cast. The left plot has temperature in blue, and salinity in green. The right plot has density in black, chlorophyll-a in green, and oxygen in blue. observe how different variables change with depth (on the y-axes)!

We next turned west to transect the continental shelf break. Here, we were hoping to observe changes in species composition as waters got deeper, and habitat changed.  The shelf break is often known as an area of upwelling and increased primary productivity, which can lead to concentrations of marine predators taking advantage of aggregations of prey. As we moved further offshore, everyone was hoping for some sperm whales, or maybe some oceanic dolphin species, and if we’re really lucky, maybe a beaked whale or two.

Black footed Albatross with immature gulls. photo credit: Leigh Torres

Today our students learned the lesson of how difficult marine mammal observation can be when our target species spend the majority of their lives underwater – where we can’t see them. While there were a couple of hours of mammal empty water in there, observers were kept busy identifying long tailed- jaegers, cassin’s auklets, murrelets, petrels, shearwaters, fulmars, and so many black-footed albatrosses, that they almost became “normal”.  That being said, we did spot a fin whale, a few groups of Dall’s porpoise, and three pacific-white-sided dolphins.  Unexpectedly, we also saw an unidentified shark, and several sunfish (mola mola)!

Humpback whale profile. photo credit: Amanda Holdman. Taken under NMFS permit 16111 John Calambokidis.
Humpback whale profile – notice the hump before the dorsal fin. photo credit: Amanda Holdman. Taken under NMFS permit 16111 John Calambokidis.
Fin Whale profile. photo credit: Amanda Holdman. Taken under NMFS permit 16111 John Calambokidis.
Fin Whale profile – notice how long the back is before the fin, and how pointed the dorsal fin is compared to the humpback. photo credit: Amanda Holdman. Taken under NMFS permit 16111 John Calambokidis.

Last but not least, we engaged in a long standing oceanographic tradition, which is to draw on Styrofoam cups, and send them down to Davy Jone’s Locker attached to the CTD.  When you bring them back up, the pressure has caused them to shrink to a fraction of their original size, which is an excellent demonstration of the crushing power of pressure (and why its harder to build a submarine than a rocket).

Shrunken cups! The first row have been sent down to 1400m, while the back row are still full size!

Now, we are steaming north toward Astoria Canyon, where we hope to make some more sightings in the morning. Stand by for news from our final day at sea.

Fin Whale. photo credit Amanda Holdman. Taken under NMFS permit 16111 John Calambokidis.
Dahl's Porpoise. photo credit: Florence Sullivan. Taken under NMFS permit 16111 John Calambokidis.
Dahl’s Porpoise. photo credit: Florence Sullivan. Taken under NMFS permit 16111 John Calambokidis.