A Marine Mammal Odyssey, Eh!

By Leila Lemos, PhD student

Dawn Barlow, MS student

Florence Sullivan, MS

The Society for Marine Mammalogy’s Biennial Conference on the Biology of Marine Mammals happens every two years and this year the conference took place in Halifax, Nova Scotia, Canada.

Logo of the Society for Marine Mammalogy’s 22nd Biennial Conference on the Biology of Marine Mammals, 2017: A Marine Mammal Odyssey, eh!

The conference started with a welcome reception on Sunday, October 22nd, followed by a week of plenaries, oral presentations, speed talks and posters, and two more days with different workshops to attend.

This conference is an important event for us, as marine mammalogists. This is the moment where we get to share our projects (how exciting!), get important feedback, and hear about different studies that are being conducted around the world. It is also an opportunity to network and find opportunities for collaboration with other researchers, and of course to learn from our colleagues who are presenting their work.

The GEMM Lab attending the opening plenaries of the conference!

The first day of conference started with an excellent talk from Asha de Vos, from Sri Lanka, where she discussed the need for increased diversity (in all aspects including race, gender, nationality, etc.) in our field, and advocated for the end of “parachute scientists” who come into a foreign (to them) location, complete their research, and then leave without communicating results, or empowering the local community to care or act in response to local conservation issues.  She also talked about the difficulty that researchers in developing countries face accessing research that is hidden behind journal pay walls, and encouraged everyone to get creative with communication! This means using blogs and social media, talking to science communicators and others in order to get our stories out, and no longer hiding our results behind the ivory tower of academia.  Overall, it was an inspirational way to begin the week.

On Thursday morning we heard Julie van der Hoop, who was this year’s recipient of the F.G. Wood Memorial Scholarship Award, present her work on “Drag from fishing gear entangling right whales: a major extinction risk factor”. Julie observed a decrease in lipid reserves in entangled whales and questioned if entanglements are as costly as events such as migration, pregnancy or lactation. Tags were also deployed on whales that had been disentangled from fishing gear, and researchers were able to see an increase in whale speed and dive depth.

Julie van der Hoop talks about different drag forces of fishing gears
on North Atlantic Right Whales.

There were many other interesting talks over the course of the week. Some of the talks that inspired us were:

— Stephen Trumble’s talk “Earplugs reveal a century of stress in baleen whales and the impact of industrial whaling” presented a time-series of cortisol profiles of different species of baleen whales using earplugs. The temporal data was compared to whaling data information and they were able to see a high correlation between datasets. However, during a low whaling season concurrent to the World War II in the 40’s, high cortisol levels were potentially associated to an increase in noise from ship traffic.

— Jane Khudyakov (“Elephant seal blubber transcriptome and proteome responses to single and repeated stress”) and Cory Champagne (“Metabolomic response to acute and repeated stress in the northern elephant seal”) presented different aspects of the same project. Jane looked at down/upregulation of genes (downregulation is when a cell decreases the quantity of a cellular component, such as RNA or protein, in response to an external stimulus; upregulation is the opposite: when the cell increases the quantity of cellular components) to check for stress. She was able to confirm an upregulation of genes after repeated stressor exposure. Cory checked for influences on the metabolism after administering ACTH (adrenocorticotropic hormone: a stimulating hormone that causes the release of glucocorticoid hormones by the adrenal cortex. i.e., cortisol, a stress related hormone) to elephant seals. By looking only at the stress-related hormone, he was not able to differentiate acute from chronic stress responses. However, he showed that many other metabolic processes varied according to the stress-exposure time. This included a decrease in amino acids, mobilization of lipids and upregulation of carbohydrates.

— Jouni Koskela (“Fishing restrictions is an essential protection method of the Saimaa ringed seal”) talked about the various conservation efforts being undertaken for the endangered Lake Saimaa ringed seal. Gill nets account for 90% of seal pup mortality, but if new pups can reach 20kg, only 14% of them will drown in these fishing net entanglements. Working with local industry and recreational interests, increased fishing restrictions have been enacted during the weaning season. In addition to other year-round restrictions, this has led to a small, but noticeable upward trend in pup production and population growth! A conservation success story is always gratifying to hear, and we wish these collaborative efforts continued future success.

— Charmain Hamilton (“Impacts of sea-ice declines on a pinnacle Arctic predator-prey relationship: Habitat, behaviour, and spatial overlap between coastal polar bears and ringed seals”) gave a fascinating presentation looking at how changing ice regimes in the arctic are affecting spatial habitat use patterns of polar bears. As ice decreases in the summer months, the polar bears move more, resulting in less spatial overlap with ringed seal habitat, and so the bears have turned to targeting ground nesting seabirds.  This spatio-temporal mismatch of traditional predator/prey has drastic implications for arctic food web dynamics.

— Nicholas Farmer’s presentation on a Population Consequences of Disturbance (PCoD) model for assessing theoretical impacts of seismic survey on sperm whale population health had some interesting parallels with new questions in our New Zealand blue whale project. By simulating whale movement through modeled three-dimensional sound fields, he found that the frequency of the disturbance (i.e., how many days in a row the seismic survey activity persisted) was very important in determining effects on the whales. If the seismic noise persists for many days in a row, the sperm whales may not be able to replenish their caloric reserves because of ongoing disturbance. As you can imagine, this pattern gets worse with more sequential days of disturbance.

— Jeremy Goldbogen used suction cup tags equipped with video cameras to peer into an unusual ecological niche: the boundary layer of large whales, where drag is minimized and remoras and small invertebrates compete and thrive. Who would have thought that at a marine mammal conference, a room full of people would be smiling and laughing at remoras sliding around the back of a blue whale, or barnacles filter feeding as they go for a ride with a humpback whale? Insights from animals that occupy this rare niche can inform improvements to current tag technologies.

The GEMM Lab was well represented this year with six different talks: four oral presentations and two speed talks! It is evident that all of our hard work and preparation, such as practicing our talks in front of our lab mates two weeks in advance, paid off.  All of the talks were extremely well received by the audience, and a few generated intelligent questions and discussion afterwards – exactly as we hoped.  It was certainly gratifying to see how packed the room was for Sharon’s announcement of our new method of standardizing photogrammetry from drones, and how long the people stayed to talk to Dawn after her presentation about an unique population of New Zealand blue whales – it took us over an hour to be able to take her away for food and the celebratory drinks she deserved!

GEMM Lab members on their talks. From left to right, top to bottom: Amanda Holdman, Leila Lemos, Solène Derville, Dawn Barlow, Sharon Nieukirk, and Florence Sullivan.


GEMM Lab members at the closing celebration. From left to right: Florence Sullivan, Leila Lemos, Amanda Holdman, Solène Derville, and Dawn Barlow.
We are not always serious, we can get silly sometimes!

The weekend after the conference many courageous researchers who wanted to stuff their brains with even more specialized knowledge participated in different targeted workshops. From 32 different workshops that were offered, Leila chose to participate in “Measuring hormones in marine mammals: Current methods, alternative sample matrices, and future directions” in order to learn more about the new methods, hormones and matrices that are being used by different research groups and also to make connections with other endocrinologist researchers. Solène participated in the workshop “Reproducible Research with R, Git, and GitHub” led by Robert Shick.  She learned how to better organize her research workflow and looks forward to teaching us all how to be better collaborative coders, and ensure our analysis is reproducible by others and by our future selves!

On Sunday none of us from the GEMM Lab participated in workshops and we were able to explore a little bit of the Bay of Fundy, an important area for many marine mammal species. Even though we didn’t spot any marine mammals, we enjoyed witnessing the enormous tidal exchange of the bay (the largest tides in the world), and the fall colors of the Annaoplis valley were stunning as well. Our little trip was fun and relaxing after a whole week of learning.

The beauty of the Bay of Fundy.
GEMM Lab at the Bay of Fundy; from left to right: Kelly Sullivan (Florence’s husband and a GEMM Lab fan), Florence Sullivan, Dawn Barlow, Solène Derville, and Leila Lemos.
We do love being part of the GEMM Lab!

It is amazing how refreshing it is to participate in a conference. So many ideas popping up in our heads and an increasing desire to continue doing research and work for conservation of marine mammals. Now it’s time to put all of our ideas and energy into practice back home! See you all in two years at the next conference in Barcelona!

Flying out of Halifax!

Finding the edge: Preliminary insights into blue whale habitat selection in New Zealand

By Dawn Barlow, MSc student, OSU Department of Fisheries and Wildlife, Geospatial Ecology of Marine Megafauna Lab

I was fortunate enough to spend the Austral summer in the field, and so while the winter rain poured down on Oregon I found myself on the water with the sun and wind on my face, looking for blue whales in New Zealand. This spring I switched gears and spent time taking courses to build my analytical toolbox. In a course on technical writing and communication, I was challenged to present my research using only pictures and words with no written text, and to succinctly summarize the importance of my research in an introduction to a technical paper. I attended weekly seminars to learn about the diverse array of marine science being conducted at Oregon State University and beyond. I also took a course entitled “Advanced Spatial Statistics and Geographic Information Science”. In this skill-building course, we were given the opportunity to work with our own data. Even though my primary objective was to expand the tools in my toolbox, I was excited to explore preliminary results and possible insight into blue whale habitat selection in my study area, the South Taranaki Bight region (STB) of New Zealand (Figure 1).

Figure 1. A map of New Zealand, with the South Taranaki Bight (STB) region delineated by the black box. Farewell Spit is denoted by a star, and Kahurangi point is denoted by an X.

Despite the recent documentation of a foraging ground in the STB, blue whale distribution remains poorly understood in New Zealand. The STB is New Zealand’s most industrially active marine region, and the site of active oil and gas extraction and exploration, busy shipping traffic, and proposed seabed mining. This potential space-use conflict between endangered whales and industry warrants further investigation into the spatial and temporal extent of blue whale habitat in the region. One of my research objectives is to investigate the relationship between blue whales and their environment, and ultimately to build a model that can predict blue whale presence based on physical and biological oceanographic features. For this spring term, the question I asked was:

Is the number of blue whales present in an area correlated with remotely-sensed sea surface temperature and chlorophyll-a concentration?

For the purposes of this exploration, I used data from our 2017 survey of the STB. This meant importing our ship’s track and our blue whale sighting locations into ArcGIS, so that the data went from looking like this:

… to this:

The next step was to get remote-sensed images for sea surface temperature (SST) and chlorophyll-a (chl-a) concentration. I downloaded monthly averages from the NASA Moderate Resolution Imaging Spectrometer (MODIS aqua) website for the month of February 2017 at 4 km2 resolution, when our survey took place. Now, my images looked something more like this:

But, I can’t say anything reliable about the relationships between blue whales and their environment in the places we did not survey.  So next I extracted just the portions of my remote-sensed images where we conducted survey effort. Now my maps looked more like this one:

The above map shows SST along our ship’s track, and the locations where we found whales. Just looking at this plot, it seems like the blue whales were observed in both warmer and colder waters, not exclusively in one or the other. There is a productive plume of cold, upwelled water in the STB that is generated off of Kahurangi point and curves around Farewell Spit and into the bight (Figure 1). Most of the whales we saw appear to be near that plume. But how can I find the edges of this upwelled plume? Well, I can look at the amount of change in SST and chl-a across a spatial area. The places where warm and cold water meet can be found by assessing the amount of variability—the standard deviation—in the temperature of the water. In ArcGIS, I calculated the deviation in SST and chl-a concentration across the surrounding 20 km2 for each 4 km2 cell.

Now, how do I tie all of these qualitative visual assessments together to produce a quantitative result? With a statistical model! This next step gives me the opportunity to flex some other analytical muscles, and practice using another computational tool: R. I used a generalized additive model (GAM) to investigate the relationships between the number of blue whales observed in each 4 km2 cell our ship surveyed and the remote-sensed variables. The model can be written like this:

Number of blue whales ~ SST + chl-a + sd(SST) + sd(chl-a)

In other words, are SST, chl-a concentration, deviation in SST, and deviation in chl-a concentration correlated with the number of blue whales observed within each 4 km2 cell on my map?

This model found that the most important predictor was the deviation in SST. In other words, these New Zealand blue whales may be seeking the edges of the upwelling plume, honing in on places where warm and cold water meet. Thinking back on the time I spent in the field, we often saw feeding blue whales diving along lines of mixing water masses where the water column was filled with aggregations of krill, blue whale prey. Studies of marine mammals in other parts of the world have also found that eddies and oceanic fronts—edges between warm and cold water masses—are important habitat features where productivity is increased due to mixing of water masses. The same may be true for these New Zealand blue whales.

These preliminary findings emphasize the benefit of having both presence and absence data. The analysis I have presented here is certainly strengthened by having environmental measurements for locations where we did not see whales. This is comforting, considering the feelings of impatience generated by days on the water spent like this with no whales to be seen:

Moving forward, I will include the blue whale sighting data from our 2014 and 2016 surveys as well. As I think about what would make this model more robust, it would be interesting to see if the patterns become clearer when I incorporate behavior into the model—if I look at whales that are foraging and traveling separately, are the results different? I hope to explore the importance of the upwelling plume in more detail—does the distance from the edge of the upwelling plume matter? And finally, I want to adjust the spatial and temporal scales of my analysis—do patterns shift or become clearer if I don’t use monthly averages, or if I change the grid cell sizes on my maps?

I feel more confident in my growing toolbox, and look forward to improving this model in the coming months! Stay tuned.

What it looks like when science meets management decisions

Dr. Leigh Torres
GEMM Lab, OSU, Marine Mammal Institute

It’s often difficult to directly see the application of our research to environmental management decisions. This was not the case for me as I stepped off our research vessel Tuesday morning in Wellington and almost directly (after pausing for a flat white) walked into an environmental court hearing regarding a permit application for iron sands mining in the South Taranaki Bight (STB) of New Zealand (Fig. 1). The previous Thursday, while we surveyed the STB for blue whales, I received a summons from the NZ Environmental Protection Authority (EPA) to appear as an expert witness regarding blue whales in NZ and the potential impacts of the proposed mining activity by Trans-Tasman Resources Ltd. (TTR) on the whales. As I sat down in front of the four members of the EPA Decision Making Committee, with lawyers for and against the mining activity sitting behind me, I was not as prepared as I would have liked – no business clothes, no powerpoint presentation, no practiced summary of evidence. But, I did have new information, fresh perspective, and the best available knowledge of blue whales in NZ. I was there to fill knowledge gaps, and I could do that.

Figure 1. Distribution map of blue whale sightings (through Nov 2016) in the South Taranaki Bight (STB) of New Zealand, color-coded by month. Also identified are the current locations of oil and gas platforms (black flags) and the proposed area for seabed mining (yellow polygon). The green stars denote the location of our hydrophones within the STB that record blue whale vocalizations. The source of the upwelling plume at Kahurangi Point, on the NW tip of the South Island, is also identified.

For over an hour I was questioned on many topics. Here are a few snippets:

Why should the noise impacts from the proposed iron sands mining operation on blue whales be considered when seismic survey activity produces noise 1,000 to 100,000 times louder?

My answer: Seismic survey noise is very loud, but it’s important to note that seismic and mining noises are two different types of sound sources. Seismic surveys noise is an impulsive noise (a loud bang every ~8 seconds), while the mining operation will produce non-impulsive (continuous) sound. Also, the mining operation will likely be continuous for 32 years. Therefore, these two sound sources are hard to compare. It’s like comparing the impacts of listening to pile driving for a month, and listening to a vacuum cleaner for 32 years. What’s important here is to considering the cumulative effects of both these noise sources occurring at the same time: pile driving on top of vacuum cleaner.


How many blue whales have been sighted within 50 km of the proposed mining site?

My answer: Survey effort in the STB has been very skewed because most marine mammal sighting records have come from marine mammal observers aboard seismic survey vessels that primarily work in the western regions of the STB, while the proposed mining site is in the eastern region. So at first glance at a distribution map of blue whale sightings (Fig. 1) we may think that most of the blue whales are found in the western region of the STB, but this is incorrect because we have not accounted for survey effort.

During our past three surveys in the STB we have surveyed closer to the proposed mining site. In 2014 our closest point of survey approach to the mining site was 26 km, and our closest sighting was 63 km away. In 2016, we found no whales north of 40’ 30” in the STB and the closest sighting was 107 km away from the proposed mining site, but this was a different oceanographic year due to El Niño conditions. During this recent survey in 2017, our closest point of survey approach to the proposed mining site was 22 km, and our closest sighting was 29 km, with a total of 9 sightings of 16 blue whales within 50 km of the proposed mining site. With all reported sighting records of blue whales tabulated, there have been 16 sightings of 33 blue whales within 50 km of the proposed mining site. Considering the minimal survey effort in this region, this is actually a relatively high number of blue whale sighting records near the proposed mining site.

Additionally, we have a hydrophone located 18.8 km from the proposed mining site. We have only analyzed the data from January through June 2016 so far, but during this period we have an 89% daily detection rate of blue whale calls.


Why are blue whales in the STB and where else are they found in NZ?

My answer: A  wind-driven upwelling system occurs off Kahurangi Point (Fig. 1) along the NW coast of the South Island. This upwelling brings nutrient rich deep water to the surface where it meets the sunlight causing primary productivity to begin. Currents push these productive plumes of water into the STB and zooplankton, such as krill that is the main prey item of blue whales, aggregate in these productive areas to feed on the phytoplankton. Blue whales spend time in the STB because they depend on the predictability of these large krill aggregations in the STB to feed efficiently.

Sightings of blue whales have been reported in other areas around New Zealand, but nowhere with regular frequency or abundance. There may be other areas where blue whales feed occasionally or regularly in New Zealand waters, but these areas have not been documented yet. We don’t know very much about these newly documented New Zealand blue whales, yet what we do know is that the STB is an important foraging area for these animals.


Questions like these went on and on, and I was probed with many insightful questions. Yet, the question that sticks with me now was asked by the Chair of the Decision Making Committee regarding the last sentence in my submitted evidence where I remarked on the importance of recognizing the innate right of animals to live in their habitat without disturbance. “This sounds like an absolute statement,” claimed the Chair, “like no level of disturbance is tolerable”. I was surprised by the Chair’s focus on this statement over others. I reiterated my opinion that we, as a society, need to recognize the right of all animals to live in undisturbed habitats whenever we consider any new human activity. “That’s why we are all here today”, I explained to the committee, “to recognize and evaluate the potential impacts of TTR’s proposed mining operation on blue whales, and other animals, in the STB”. Undisturbed habitat may not always be achievable, but when we make value-based decisions regarding permitting industrial projects we need to recognize biodiversity’s right to live in uncompromised environments.

I do not envy this Decision Making Committee, as over three weeks they are hearing evidence from all sides on a multitude of topics from environmental, to economic, to cultural impacts of the proposed mining operation. They will be left with the very hard task of balancing all this information and deciding to approve or decline the mining permit, which would be a first in NZ and may open the floodgates of seabed mining in the country. My only hope is that our research on blue whales in NZ over the last five years has filled knowledge gaps, allowing the Decision Making Committee to fully appreciate the importance of the STB habitat to NZ blue whales, and appropriately consider the potential impacts of TTR’s proposed mining activities on this unique population.

A blue whale surfaces in a calm sea in the South Taranaki Bight of New Zealand (Photo L. Torres).

Oceanus Day Three: Dolphin Delights

by Florence Sullivan, MSc student

Our third day aboard the Oceanus began in the misty morning fog before the sun even rose. We took the first CTD cast of the day at 0630am because the physical properties of the water column do not change much with the arrival of daylight. Our ability to visually detect marine mammals, however, is vastly improved with a little sunlight, and we wanted to make the best use of our hours at sea possible.

Randall Munroe www.XKCD.com

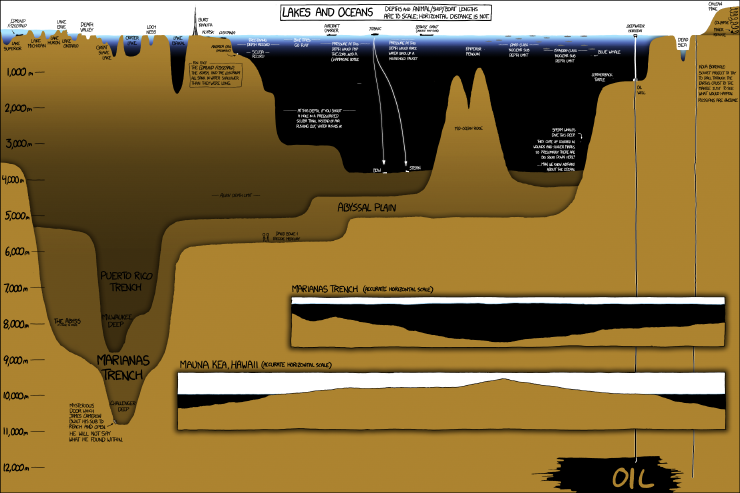
Our focus on day three was the Astoria canyon – a submarine feature just off the Oregon and Washington coast. Our first oceanographic station was 40 miles offshore, and 1300 meters deep, while the second was 20 miles offshore and only 170 meters deep.  See the handy infographic below to get a perspective on what those depths mean in the grand scheme of things.  From an oceanographic perspective, the neatest finding of the day was our ability to detect the freshwater plume coming from the Columbia River at both those stations despite their distance from each other, and from shore! Water density is one of the key characteristics that oceanographers use to track parcels of water as they travel through the ocean conveyor belt. Certain bodies of water (like the Mediterranean Sea, or the Atlantic or Pacific Oceans) have distinct properties that allow us to recognize them easily. In this case, it was very exciting to “sea” the two-layer system we had gotten used to observing overlain with a freshwater lens of much lower salinity, higher temperature, and lower density. This combination of freshwater, saltwater, and intriguing bathymetric features can lead to interesting foraging opportunities for marine megafauna – so, what did we find out there?

Click through link for better resolution: Randall Munroe www.XKCD.com/1040/large

Morning conditions were almost perfect for marine mammal observations – glassy calm with low swell, good, high, cloud cover to minimize glare and allow us to catch the barest hint of a blow….. it should come as no surprise then, that the first sightings of the day were seabirds and tuna!

I didn't catch any photos of the Tuna, so here's some mola mola we spotted. photo credit: Florence Sullivan
I didn’t catch any photos of the tuna, so here’s some sunfish we spotted. photo credit: Florence Sullivan

One of the best things about being at sea is the ability to look out at the horizon and have nothing but water staring back at you. It really drives home all the old seafaring superstitions about sailing off the edge of the world.  This close to shore, and in such productive waters, it is rare to find yourself truly alone, so when we spot a fishing trawler, there’s already a space to note it in the data log.  Ships at sea often have “follower” birds – avians attracted by easy meals as food scraps are dumped overboard. Fishing boats usually attract a lot of birds as fish bycatch and processing leftovers are flushed from the deck.  The birders groan, because identification and counts of individuals get more and more complicated as we approach other vessels.  The most thrilling bird sighting of the day for me were the flocks of a couple hundred fork-tailed storm petrels.

Fork-tailed storm petrels
Fork-tailed storm petrels. photo credit: Florence Sullivan

I find it remarkable that such small birds are capable of spending 80% of their life on the open ocean, returning to land only to mate and raise a chick. Their nesting strategy is pretty fascinating too – in bad foraging years, the chick is capable of surviving for several days without food by going into a state of torpor. (This slows metabolism and reduces growth until an adult returns.)

Just because the bird observers were starting to feel slightly overwhelmed, doesn’t mean that the marine mammal observers stopped their own survey.  The effort soon paid off with shouts of “Wait! What are those splashes over there?!” That’s the signal for everyone to get their binoculars up, start counting individuals, and making note of identifying features like color, shape of dorsal fin, and swimming style so that we can make an accurate species ID. The first sighting, though common in the area, was a new species for me – Pacific white sided dolphins!

Pacific white sided dolphin
A Pacific white sided dolphin leaps into view. photo credit: Florence Sullivan. Taken under NMFS permit 16111 John Calambokidis

A pod of thirty or so came to ride our bow wake for a bit, which was a real treat. But wait, it got better! Shortly afterward, we spotted more activity off the starboard bow.  It was confusing at first because we could clearly see a lot of splashes indicating many individuals, but no one had glimpsed any fins to help us figure out the species. As the pod got closer, Leigh shouted “Lissodelphis! They’re lissodelphis!”  We couldn’t see any dorsal fins, because northern right whale dolphins haven’t got one! Then the fly bridge became absolute madness as we all attempted to count how many individuals were in the pod, as well as take pictures for photo ID. It got even more complicated when some more pacific white sided dolphins showed up to join in the bow-riding fun.

Northern right whale dolphins are hard to spot! photo credit: Florence Sullivan Taken under NMFS permit 16111 John Calambokidis

All told, our best estimates counted about 200 individuals around us in that moment. The dolphins tired of us soon, and things continued to calm down as we moved further away from the fishing vessels.  We had a final encounter with an enthusiastic young humpback who was breaching and tail-slapping all over the place before ending our survey and heading towards Astoria to make our dock time.

Humpback whale breach
Humpback whale breach. photo credit: Florence Sullivan. Taken under NMFS permit 16111 John Calambokidis

As a Washington native who has always been interested in a maritime career, I grew up on stories of The Graveyard of the Pacific, and how difficult the crossing of the Columbia River Bar can be. Many harbors have dedicated captains to guide large ships into the port docks.  Did you know the same is true of the Columbia River Bar?  Conditions change so rapidly here, the shifting sands of the river mouth make it necessary for large ships to receive a local guest pilot (often via helicopter) to guide them across.  The National Motor Lifeboat School trains its students at the mouth of the river because it provides some of “the harshest maritime weather conditions in the world”.  Suffice it to say, not only was I thrilled to be able to detect the Columbia River plume in our CTD profile, I was also supremely excited to finally sail across the bar.  While a tiny part of me had hoped for a slightly more arduous crossing (to live up to all the stories you know), I am happy to report that we had glorious, calm, sunny conditions, which allowed us all to thoroughly enjoy the view from the fly bridge.

Cape Disappointment Lighthouse at the Columbia River Bar.

Finally, we arrived in Astoria, loaded all our gear into the ship’s RHIB (Ridged Hulled Inflatable Boat), lowered it into the river, descended the rope ladder, got settled, and motored into port. We waved goodbye to the R/V Oceanus, and hope to conduct another STEM cruise aboard her again soon.

Now if the ground would stop rolling, that would be just swell.

Last but not least, here are the videos we promised you in Oceanus Day Two – the first video shows the humpback lunge feeding behavior, while the second shows tail slapping. Follow our youtube channel for more cool videos!


Oceanus Day Two: All the Albatrosses

By Amanda Holdman and Florence Sullivan

Today got off to a bright and early start. As soon as daylight permitted, we had spotters out on duty looking for more marine mammals. We began to survey at the north end of Heceta bank, where we again encountered many humpback whales lunge feeding. We broke transect, and got some great video footage of a pair them – so check our youtube channel next week – we’ll upload the video as soon as we get back to better internet (dial up takes some getting used to again – the whales don’t know about highspeed yet).

Humpbacks lunge feeding at surface. photo credit: Leigh Torres. Taken under NMFS permit 16111 John Calambokidis.

After working with the humpbacks to capture photo-id data for about an hour, we turned south, and ran parallel to Heceta bank until we reached the southern edge. Along the way, we counted 30 humpbacks, and many California gulls, marbled murrelets, pink footed shearwaters, and sooty shearwaters.

After lunch, we conducted a CTD cast to see how conditions might be different between the southern and northern edges of the bank. Surface temperatures increased from 12.09C to 13.2C while bottom temperatures decreased from 8.7C to 7.8C.  The northern station was a textbook perfect two layer system. It had a well mixed surface layer with a steep pycnocline separating it from the colder, saltier, denser, bottom layer. The southern station still had two layers, but the pycnocline (the depth where a rapid change in density occurs, which delineates the edges of water masses) was not as steep. We are interested in these discreet measurements of ocean conditions because areas of high primary productivity (the green chlorophyll-a line) are often re-occurring hot spots of food for many levels of the food chain. Since we can’t phone the whales and ask them where to meet up, we use clues like these to anticipate the best place to start looking.

Readout of the CTD cast. The left plot has temperature in blue, and salinity in green. The right plot has density in black, chlorophyll-a in green, and oxygen in blue. observe how different variables change with depth!
Readout of the CTD cast. The left plot has temperature in blue, and salinity in green. The right plot has density in black, chlorophyll-a in green, and oxygen in blue. observe how different variables change with depth (on the y-axes)!

We next turned west to transect the continental shelf break. Here, we were hoping to observe changes in species composition as waters got deeper, and habitat changed.  The shelf break is often known as an area of upwelling and increased primary productivity, which can lead to concentrations of marine predators taking advantage of aggregations of prey. As we moved further offshore, everyone was hoping for some sperm whales, or maybe some oceanic dolphin species, and if we’re really lucky, maybe a beaked whale or two.

Black footed Albatross with immature gulls. photo credit: Leigh Torres

Today our students learned the lesson of how difficult marine mammal observation can be when our target species spend the majority of their lives underwater – where we can’t see them. While there were a couple of hours of mammal empty water in there, observers were kept busy identifying long tailed- jaegers, cassin’s auklets, murrelets, petrels, shearwaters, fulmars, and so many black-footed albatrosses, that they almost became “normal”.  That being said, we did spot a fin whale, a few groups of Dall’s porpoise, and three pacific-white-sided dolphins.  Unexpectedly, we also saw an unidentified shark, and several sunfish (mola mola)!

Humpback whale profile. photo credit: Amanda Holdman. Taken under NMFS permit 16111 John Calambokidis.
Humpback whale profile – notice the hump before the dorsal fin. photo credit: Amanda Holdman. Taken under NMFS permit 16111 John Calambokidis.
Fin Whale profile. photo credit: Amanda Holdman. Taken under NMFS permit 16111 John Calambokidis.
Fin Whale profile – notice how long the back is before the fin, and how pointed the dorsal fin is compared to the humpback. photo credit: Amanda Holdman. Taken under NMFS permit 16111 John Calambokidis.

Last but not least, we engaged in a long standing oceanographic tradition, which is to draw on Styrofoam cups, and send them down to Davy Jone’s Locker attached to the CTD.  When you bring them back up, the pressure has caused them to shrink to a fraction of their original size, which is an excellent demonstration of the crushing power of pressure (and why its harder to build a submarine than a rocket).

Shrunken cups! The first row have been sent down to 1400m, while the back row are still full size!

Now, we are steaming north toward Astoria Canyon, where we hope to make some more sightings in the morning. Stand by for news from our final day at sea.

Fin Whale. photo credit Amanda Holdman. Taken under NMFS permit 16111 John Calambokidis.
Dahl's Porpoise. photo credit: Florence Sullivan. Taken under NMFS permit 16111 John Calambokidis.
Dahl’s Porpoise. photo credit: Florence Sullivan. Taken under NMFS permit 16111 John Calambokidis.

R/V Oceanus Day One: Hungry Hungry Humpbacks

By Florence Sullivan and Amanda Holdman

The GEMM lab is adventuring out into the wild blue yonder of open ocean sampling and educational outreach! Leigh is the chief scientist onboard the R/V Oceanus for the next two days as we sail through Oregon waters in search of marine megafauna. Also onboard are four local teachers and five high school students who are learning the tricks of the trade. Amanda and I are here to help teach basic oceanography and distance sampling techniques to our enthusiastic students.

Science Party musters in the dry lab for safety debrief. photo credit: Florence Sullivan

We started the morning with safety briefings, and headed out through the Newport breakwater, direction: Stonewall Bank.  Stonewall is a local bathymetric feature where upwelling often occurs, leading to a productive ecosystem for both predators and prey. Even though our main sampling effort will be offshore this trip, we didn’t even make out of the harbor before recording our first gray whale and California sea lion sightings.

California Sea Lions on the Newport buoy. Taken under NMFS permit 16111 John Calambokidis

Our students (and their teachers) are eager and quick to catch on as we teach them new methodologies. Amanda and I had prepared presentations about basic oceanographic and distance sampling methods, but really the best way to learn is to jump in and go. We’ve set up a rotation schedule, and everyone is taking turns scanning the ocean for critters, deploying and recovering the CTD, logging data, and catching plankton.

a small pod of Orca. Photo credit: Florence Sullivan. Taken under NMFS permit 16111 John Calambokidis
A small pod of Orca. Photo credit: Florence Sullivan. Taken under NMFS permit 16111 John Calambokidis

So far, we have spotted gray whales, sea lions, a pod of (lightning speed) killer whales, lots of seagulls, northern fulmars, sooty shearwaters, storm petrels, and cormorants, but today’s highlight has to the last sighting of ~42 humpback whales. We found them at the Northern edge of Heceta Bank – a large rocky reef which provides structural habitat for a wide variety of marine species. As we approached the area, we spotted one whale, and then another. At first, our spotters had no trouble inputting the data, getting photo-ID shots, and distinguishing one whale from the next, but as we continued, we were soon overwhelmed. With whale blows surrounding us on all sides, it was hard to know where to look first – here a surface lunge, there, a breach, a spout, a fluke, a flipper slap! The surface activity was so dense and enthralling, it took a few moments before realizing there were some sea lions in the feeding frenzy too!

Five humpback whales surface at once. photo credit: Leigh Torres. Taken under NMFS permit 16111 John Calambokidis

We observed the group, and tried to document as many individuals as possible as the sunset faded into night. When poor visibility put a stop to the visuals, we hurried to do a plankton tow and CTD cast to find some environmental insights for such a gathering. The CTD revealed a stratified water column, with two distinct layers, and the plankton tow brought up lots of diatoms and krill. As one of the goals of this cruise is to explore how marine mammals vary with ocean gradients, this is a pretty cool way to start.

A humpback whale lunge feeds. Photo credit: Leigh Torres. Taken under NMFS permit 16111 John Calambokidis

A long day observing has left us all exhausted, but not too tired to share our excitement. Stay tuned for more updates from the briny blue!

Follow this link for real time view of our beautiful ship! : http://webcam.oregonstate.edu/oceanus

Humpback flukes for photo ID. photo credit: Leigh Torres. Taken under NMFS permit 16111 John Calambokidis

Are Oregon gulls trash birds?

By Stephanie Loredo, MSc student

“Violent” and “greedy” are words often used to describe gulls in populous areas where food or trash are readily available.  Humans are used to seeing gulls in parking lots, parks, and plazas eating left over crumbs. Many people have even experienced menacing gulls ripping food away from their hands. Anecdotes like these have caused people to have negative perceptions of gulls. But could the repulsive attitude towards these birds be changed with evidence that not all gulls are the same? Well, Oregon may be home to an odd bunch.

Last year, the Seabird Oceanography Lab in conjunction with the GEMM Lab began putting GPS trackers on western gulls (Laurus occidentalis) off the Oregon Coast. One of the goals was to determine where gulls scavenge for food while raising chicks: at sea or on land in association with humans. We were particularly interested to see if western gulls in Oregon would behave similarly to western gulls in California, some of which make trips to the nearest landfill during the breeding season to bring not only food but also potentially harmful pathogens back to the colony.

During the 2015 breeding season, 10 commercially brand ‘i-gotU’ GPS data loggers were placed on gulls from ‘Cleft-in-the-Rock’ colony in Yachats, Oregon. The tags provided GPS locations at intervals of two minutes that determined the general habitat use areas (marine vs. terrestrial). After a two-week period, we were able to recapture six birds, remove tags, and download the data.   We found that these western gulls stayed close to the colony and foraged in nearby intertidal and marine zones (Figure 1). Birds showed high site faithfulness by visiting the same foraging spots away from colony. It was interesting to see that inland habitat use did not extend past 1.3 miles from shore and the only waste facility within such boundaries did not attract any birds (Figure 1). Tagged birds never crossed the 101 Highway, but rather occurred at beaches in state parks such as Neptune and Yachats Ocean Road.

Figure 1. Tracks from 6 western gulls, each color representing a unique bird, from the Cleft-in-the-Rock colony carrying micro-GPS units.

While it is hard to determine whether gulls avoided anthropogenic sources of food at the beach, preliminary analysis shows a high percentage of time spent in marine and intertidal habitat zones by half of the individuals (Figure 2). At a first glance, this is not as much as it seemed on the tracking map (Figure 1), but it nonetheless confirms that these gulls seek food in natural areas. Moreover, time spent at the colony is represented as time spent on coastal habitat on the graph, and thus “coastal” foraging values are over represented. To get a more exact estimate of coastal habitat use, future analysis will have to exclude colony locations and distinguish foraging versus resting behaviors.

Figure 2. Bar plot of the percentage of time spent in three distinct habitats for each gull carrying a GPS unit. The three-letter code represents the unique Bird ID.

‘Cleft-in-the-Rock’ is unique and its surroundings may explain why there was high foraging in intertidal and marine zones rather than within city limits. (The Cleft colony can also be tricky to get to, with a close eye on the tide at all times – See video below).  The colony site is close to the Cape Perpetua Scenic Area and surrounded by recently established conservation zones: the Cape Perpetua Marine Reserve Area, Marine Protected Area, and Seabird Protected Area (Figure 1).  Each of these areas has different regulatory rules on what is allowed to take, which you can read about here. The implication of these protected areas in place means there is more food for wildlife!  Moreover, the city of Yachats has a small population of 703 inhabitants (based on 2013 U.S Census Bureau). The small population allows the city to be relatively clean, and the waste facility is not spewing rotten odors into the air like in many big cities such as Santa Cruz (population of 62,864) where our collaborative gull study takes place. Thus, in Yachats, there is more limited odor or visual incentive to attract birds to landfills.

Field crew descends headland slope to reach ‘Cleft-in-the-Rock’ gull island in Yachats, OR (colony can be seen in distance across the water). The team must wear wetsuits and carry equipment in dry bags for protection during water crossing.

In order to determine whether gull habitat use in Yachats is a trend for all western gulls in Oregon, we need to track birds at more sites and for a longer time. That is why during the breeding season of 2016, we will be placing 30 new tags on gulls and include a new colony into the study, ‘Hunters Island’. The new colony is situated near the Pistol River, between Gold Beach and Brookings in southern Oregon, and it is part of the Oregon Islands Wildlife Refuge.

We will have 10 ‘i-gotU’ tags (Figure 3) and 20 CATS tags (Figure 4), the latter are solar powered and can collect data for several weeks, months, and hopefully even years! These tags do not need to be retrieved for data download; rather data can be accessed remotely, providing minimal disturbance to the gulls and colony. With long-term data, we can explore further into the important feeding areas for western gulls, examine rates of foraging in different habitats, and determine how extensive intertidal and marine foraging is throughout the year.

Figure 3. Taping an i-gotU tag for temporary attachment on the tail feathers of a gull.


Figure 4. Rehearsing the placement and harness attachment of a CATS tag which must be secured on the bird‘s back, looping around the wings and hips.

We are excited to kick start our field season in the next couple of weeks and see how well the new tags work. We know that some questions will be solved and many new questions will arise; and we cannot wait to start this gull-filled adventure!

References

Osterback, A.M., Frechette, D., Hayes, S., Shaffer, S., & Moore, J. (2015). Long-term shifts in anthropogenic subsidies to gulls and implications for an imperiled fish. Biological Conservation191: 606–613.

An update on Oregon’s sound sensitive marine mammal, the harbor porpoise.

By Amanda Holdman, M.S. Student

Marine renewable energy is developing at great speeds all around the world. In 2013, the Northwest Marine Renewable Energy Center (NMREC) chose Newport, Oregon as the future site of first utility-scale, grid-connected wave energy test site in the United States – The Pacific Marine Energy Center (PMEC). The development of marine energy holds great potential to help meet our energy needs – it is renewable, and it is predicted that marine energy sources could fulfill nearly one-third of the United States energy demands.

Wave energy construction in Newport could begin as early as 2017. Therefore, it is important to fully understand the potential risks and benefits of wave energy as the industry moves forward. Currently, there is limited information on wave energy devices and the potential ecological impacts that they may have on marine mammals and their habitats. In order to assess the effects of wave energy, pertinent information needs to be collected prior to the installation of the devices.

This is where I contribute to the wave energy industry in Oregon.

Harbor porpoise are a focal species when it comes to renewable energy management; they are sensitive to a range of anthropogenic sounds at very low levels of exposure and may show behavioral responses before other marine mammals, making them a great indicator species for potential problems with wave energy. Little is known about harbor porpoise in Oregon, necessitating the need to look at the fine scale habitat use patterns of harbor porpoise within the proposed wave energy sites.

I used two methods to study harbor porpoise presence and activity in coastal waters: visual boat surveys, and passive acoustic monitoring. Visual surveys have a high spatial resolution and a low temporal resolution, meaning you can conduct visual boat surveys over a wide area, but only during daylight hours. Whereas acoustic surveys have opposite characteristics; you can conduct surveys during all hours of the day, however, the range of the acoustic device is only a few hundred meters. Therefore, these methods work well together to gain complimentary information about harbor porpoise. These methods are crucial for collecting baseline data on harbor porpoise distribution, and providing valuable information for understanding, managing, and mitigating potential impacts.

Bi-monthly standard visual line-transect surveys were conducted for two full years (October 2013-2015), while acoustic devices were deployed May – October 2014. Field work ended last October, and since then, data analysis efforts have uncovered  seasonal, diel, and tidal patterns in harbor porpoise occurrence and activity.

Harbor porpoises in Oregon are thought to be seasonally migratory. With the onset of spring, coinciding with the start of the upwelling season, porpoise are thought to move inshore and abundance increases into the summer. Most births also occur during the late spring and summer. With the return of winter, porpoise are thought to leave the coastal waters and head out to the deeper waters (Dohl 1983, Barlow 1988, Green et al. 1992).

Results from my data support this seasonal trend. Both visual survey and acoustic recording data document the general pattern of peak porpoise presence occurring in the summer months of June and July, with a gradual decline of detections into the fall (Fig. 1 & 2).

1

Figure 1: Overall, from our acoustic surveys we see a large increase from May to June, suggesting the arrival of harbor porpoise to coastal waters. From July, we see a slow decline into the fall months, suggestive of harbor porpoise moving offshore.

2

Figure 2: Our data from visual surveys mimic those of our acoustic surveys. We see a large increase of porpoises from May to June and then a decline into the fall. We had very low survey effort in July, due to rough seas.  If we were able to survey more, it is likely we would have seen more harbor porpoise during this time.

Using acoustic recorders, we are able to get data on harbor porpoise occurrence throughout all hours of the day, regardless of weather conditions. We deployed hydrophones in two locations – one in a near-shore REEF habitat located 4 km from shore, and the second in the middle of the South Energy Testing Site (SETS) 12 km off-shore. These two sites differ in depth and habitat type. The REEF habitat is 30 m deep and has a rocky bottom as a habitat type, while SETS is 60 m deep and has a sandy bottom. When we compare the two sites (Figure 3), we can see that harbor porpoise have a preference for the REEF site.

Additionally, we are also able to get some indices of behavior from acoustic recordings. Equivalent to sonar or radar, marine mammals use echolocation (high frequency sounds) to communicate and navigate. Marine mammals, specifically odonotocetes, also use echolocation to locate prey at depth when there is very little or no light. Porpoises use a series of clicks during their dives, and as the porpoise approach their prey, the clicks become closer and closer together so they sound like a continuous buzz. When studying echolocation patterns in odontocetes we typically look at the inter-click-intervals (ICIs) or the time between clicks. When ICIs are very close together (less than 10 ms apart) it is considered a foraging behavior or a buzz. Anything greater than 10 ms is classified as other (or clicks in this figure).

Click_Buzz_bargraph.

Figure 3: We see harbor porpoise clicks were detected about 27% of the time at the REEF, but only 18% at SETS. Potential feeding was also higher at the REEF site (14%) compared to (4%) at SETS.

Not only did we find patterns in foraging behavior between the two sites, we also found foraging patterns across diel cycles and tidal cycles:

  1. We found a tendency for harbor porpoise to forage more at night (Figure 4).
  2. The diel pattern of harbor porpoise foraging is stronger at the SETS than the REEF site (Figure 4). This result may be due to the prey at the SETS (sandy bottom) exhibiting vertical migration with the day and night cycles since prey there do not have alternative cover, as they would in the rocky reef habitat.
  3. At the reef site, we see a relationship between increased foraging behavior and low tide (Figure 5).

ratio

Figure 4: When analyzing data for trends in foraging behavior across different sites and diel cycles, we use a ratio of buzzes to clicks, so that we incorporate both echolocation behaviors in one value. This figure shows us that the ratio of buzzes to clicks is pretty similar at the REEF site across diel periods, but there is more variation at the SETS site, with more detections at night and during sunrise.

blog_5

Figure 5: Due to the circular nature of tides rotating between high tide and low tide, circular histograms help to observe patterns. In this figure, we see a large preference for harbor porpoise to feed during low tide. We are unclear why harbor porpoise may prefer low tide, but the relationship may be due to minimal current movement that could enhance feeding opportunities for porpoises.

Overall, the combination of visual surveys and passive acoustic monitoring has provided high quality baseline data on harbor porpoise occurrence patterns. It is results like these that can help with decisions regarding wave energy siting, operation and permitting off of the Oregon Coast.

REFERENCES

Barlow, J. 1987. Abundance estimation for harbor porpoise (Phocoena phocoena) based on ship surveys along the coasts of California, Oregon and Washington. SWFC Administrative Report LJ-87-05. Southwest Fishery Center, La Jolla, CA. 36pp.

Dohl, T.P., Guess, R.C., Dunman, M.L. and Helm, R.C. 1983, Cetaceans of central and northern California, 1980-83: status, abundance, and distribution. Final Report to the Minerals Management Service, Contract 14-12-0001-29090. 285pp.

Green, G.A., Brueggeman, J. J., Grotefendt, R.A., Bowlby, C.E., Bonnel, M. L. and Balcomb, K.C. 1992. Cetacean distribution and abundance off Oregon and Washington, 1989-1990. Chapter 1 In Oregon and Washington Marine Mammal and Seabird Surveys. Ed. By J. J. Brueggeman. Minerals Management Service Contract Report 14-12-0001-30426.

New Zealand’s mega-fauna come to Newport, Oregon.

By Olivia Hamilton, PhD Candidate, University of Auckland, New Zealand.

The week leading up to my departure from New Zealand was an emotional rollercoaster. Excited, nervous, eager, reluctant… I did not feel like the fearless adventurer that I thought I was. D-day arrived and I said my final goodbyes to my boyfriend and mother at the departure gate. Off I went on my three-month research stint at the Hatfield Marine Science Center.

Some thirty hours later I touched down in Portland. I collected my bags and headed towards the public transport area at the airport. A young man greeted me, “Would you like to catch a taxi or a shuttle, ma’am?” “A taxi please! I have no idea where I am”, I responded. He nodded and smiled. I could see the confusion all over his face… My thick kiwi accent was going to make for some challenging conversations.

After a few days in Portland acclimatizing to the different way of life in Oregon, it was time to push on to Newport. I hit a stroke of luck and was able take the scenic route with one of the girls in the GEMM lab, Rachael Orben. With only one wrong turn we made it to the Oregon coast. I was instantly hit with a sense of familiarity. The rugged coastline and temperate coastal forest resembled that of the west coast of New Zealand. However, America was not shy in reminding me of where I was with its big cars, drive-through everything, and RVs larger than some small kiwi houses.

The Oregon Coast. Photo by Olivia Hamilton.

We arrived at Hatfield Marine Science Center: the place I was to call home for the next quarter of a year.

So, what am I doing here?

In short, I have come to do computer work on the other side of the world.

Dr. Leigh Torres is on my PhD committee and I am lucky enough to have been given the opportunity to come to Newport and analyze my data under her guidance.

My PhD has a broad interest in the spatial ecology of mega-fauna in the Hauraki Gulf, New Zealand. For my study, megafauna includes whales, dolphins, sharks, rays, and seabirds. The Hauraki Gulf is adjacent to Auckland, New Zealand’s most populated city and home to one of our largest commercial ports. The Hauraki Gulf is a highly productive area, providing an ideal habitat for a number of fish species, thus supporting a number of top marine predators. As with many coastal areas, anthropogenic activities have degraded the health of the Gulf’s ecosystem. Commercial and recreational fishing, run-off from surrounding urban and rural land, boat traffic, pollution, dredging, and aquaculture are some of the main activities that threaten the Gulf and the species that inhabit it. For instance, the Nationally Endangered Bryde’s whale is a year-round resident in the Hauraki Gulf and these whales spend much of their time close to the surface, making them highly vulnerable to injury or death from ship-strikes. In spite of these threats, the Gulf supports a number of top marine predators.  Therefore it is important that we uncover how these top predators are using the Gulf, in both space and time, to identify ecologically important parts of their habitat. Moreover, this study presents a unique opportunity to look at the relationships between top marine predators and their prey inhabiting a common area.

The Hauraki Gulf, New Zealand. The purple lines represent the track lines that aerial surveys were conducted along.


Common dolphins in the Hauraki Gulf. Photo by Olivia Hamilton


A Bryde’s whale, common dolphins, and some opportunistic seabirds foraging in the Hauraki Gulf. Photo by Isabella Tortora Brayda di Belvedere.


Australisian Gannets and shearwaters foraging on a bait ball in the Hauraki Gulf. Photo by Olivia Hamilton.

To collect the data needed to understand the spatial ecology of these megafauna, we conducted 22 aerial surveys over a year-long period along pre-determined track lines within the Hauraki Gulf. On each flight we had four observers that collected sightings data for cetaceans, sharks, predatory fish, prey balls, plankton, and other rare species such as manta ray. An experienced seabird observer joined us approximately once a month to identify seabirds. We collected environmental data for each sighting including Beaufort Sea State, glare, and water color.

The summary of our sightings show that common dolphins were indeed common, being the most frequent species we observed. The most frequently encountered sharks were bronze whalers, smooth hammerhead sharks, and blue sharks. Sightings of Bryde’s whales were lower than we had hoped, most likely an artifact of our survey design relative to their distribution patterns. In addition, we counted a cumulative total of 11,172 individual seabirds representing 16 species.

Summary of sightings of megafauna in the Hauraki Gulf.

Summary of sightings of megafauna in the Hauraki Gulf.My goal while here at OSU is to develop habitat models for the megafauna species to compare the drivers of their distribution patterns. But, at the moment I am in the less glamorous, but highly important, data processing and decision-making stage. I am grappling with questions like: What environmental variables affected our ability to detect which species on surveys? How do we account for this? Can we clump species that are functionally similar to increase our sample size? These questions are important to address in order to produce reliable results that reflect the megafauna species true distribution patterns.

Once these questions are addressed, we can get on to the fun stuff – the habitat modeling and interpretation of the results. I will hopefully be able to start addressing these questions soon: What environmental and biological variables are important predictors of habitat use for different taxa? Are there interactions (attraction or repulsion) between these top predators? What is driving these patterns? Predator avoidance? Competition? So many questions to ask! I am looking forward to answering these questions and reporting back.

From Oregon to New Caledonia: Crossing latitudes

**GUEST POST** written by Solène Derville from the Institute of Research for Development, Nouméa, New Caledonia. Entropie Lab

Last term I posted about the analysis of Maui dolphin habitat selection I have undergone under Dr Leigh Torres’ supervision at OSU. The results of this work are now compiled in a manuscript which I hope to submit for publication very soon.

Since I last posted on this blog, many things have changed for me: I went back to France at the end of May (with a heavy heart from leaving Newport and my dear lab mates) and I have graduated from the Ecole Normale Supérieure of Lyon and successfully completed my Biology Master’s degree. In September, I will start a PhD on the spatial ecology of Humpback Whales in New Caledonia. I will work at the French ‘Institut de Recherche pour le Développement’ in Nouméa, New Caledonia, under the co-supervision of Dr Claude Payri, Dr Claire Garrigue, Dr Corina Iovan (IRD) and Dr Leigh Torres (GEMM Lab, OSU).

Before telling you a bit more about my project and this summer field season, I would like to introduce the beautiful place where I will be spending the next 3 years. New Caledonia is an archipelago located in the southwest Pacific Ocean, east of Australia. This special overseas French collectivity includes a main island (Grande Terre) and several other islands such as the Loyalty Islands. New Caledonia’s lagoon is the largest in the world and was added to the list of the UNESCO world heritage sites in 2008, because of its exceptional biodiversity including many emblematic species such as humpback whales, dugongs, marine turtles, manta rays…and many others.

).new+caledonia+mapNew Caledonia location in South Pacific Ocean (map: http://springtimeofnations.blogspot.jp

map_of_new-caledonialonelyplanet

Map of the New Caledonian Archipelago (map: http://crosbiew.wordpress.com).

Moreover, the ‘Natural Park of the Coral Sea’ was established very recently by the New Caledonian to protect this biodiversity hotspot. This monumental marine park spans 1.3 million square kilometres and is, to date, the largest protected area on the planet. As the detailed management plan for this park will be progressively established in the coming years, there is a local need for more information about marine mega-fauna space use in order to define key areas for wildlife conservation. Thus, the description of the humpback whales ecological niche in New Caledonian waters is the next logical step to initiate conservation planning. The effect of human activities needs to be investigated as the New Caledonian humpback whales population forms an isolated breeding sub-stock and is exposed to mining industry intensification, shipping, harbour construction and boat recreation associated to tourism development.

The general aim of my project is to investigate how humpback whales are using their habitat within and between reproductive areas of Oceania in order to facilitate their conservation at the scale of giant marine reserves (new generation of marine protected areas over vast surfaces exceeding hundreds of thousands of square kilometres). I will therefore focus on the spatial ecology of humpback whales in the New Caledonian Exclusive Economic Zone, with several specific aims:

1/ to quantify the spatio-temporal patterns and dynamics of humpback whale distribution in New Caledonian waters in order to identify key areas for the species and determine if these areas change over time or depending on social context.

2/ to assess the connectivity and movement patterns between areas of interest at individual scale.

3/ to document humpback whale use of habitat in relation to environmental factors and include these results in the broader-context of the South Pacific Ocean breeding areas.

4/ to provide a spatial and temporal assessment of the anthropogenic activities risks to humpback whales in New Caledonia.

I will rely on a large amount of data collected between 1991 and present, and provided by Opération Cétacés (an NGO involved in scientific research on humpback whales and other marine mammals in Oceania since 1996), including boat-based, land-based and aerial observations, satellite tracking and individual-based information (via Photo-Identification and genotyping).

This year, I am taking part in the summer field mission undergone by Opération Cétacés in the South Lagoon. I am currently living in Prony, a little village located along the southern coast of Grande Terre. No electricity, no internet, whale watching from 7am to 4pm on a daily basis: the real life!

In my next post I will tell you a bit more about this field trip with Opération Cétacés but for now, I will let you enjoy these few pictures!

IMG_3813

Prony Bay (© S. Derville)

IMG_3739

Rémi, Claire and Daisy standing next to the “Cap N’Dua” lighthouse from which land observations are made. Whales can be spotted up to 20 nautical miles offshore (© S. Derville) 

IMG_3820

View to the East of Cap N’Dua (© S. Derville)

2015-08-09-50D- 083
Breach observed a few days ago in the South Lagoon (© C. Garrigue)

2015-08-13-40D- 126

Inverted peduncle slap (the whale is lying upside down in the water and energetically slapping the surface with its fluke) (© S. Derville).