“Marching for Science” takes many forms

By Florence Sullivan, MSc student, Oregon State University.

Earth day is a worldwide event celebrated annually on April 22, and is typically observed with beach, park, or neighborhood clean ups, and outreach events sponsored by environmental groups.  Last year, environmentalists rejoiced when 195 nations signed the Paris Agreement – to “strengthen global response to the threat of climate change by keeping global temperature rise below 2 degrees C”.

GEMM Lab member Dawn Barlow helps carry the banner for the Newport, OR March for Science which over 600 people attended. photo credit: Maryann Bozza

This year, the enviro-political mood is more somber. Emotions in the GEMM Lab swing between anger and dismay to cautious optimism and hope. The anger comes from threatened budget cuts, the dismissal of climate science, and the restructuring of government agencies, while we find hope at the outpouring of support from our local communities, and the energy building behind the March for Science movement.

The Newport March for Science. photo credit: Maryann Bozza

What is perhaps most striking about the movement is how celebratory it feels. Instead of marching against something, we are marching FOR science, in all its myriad forms. With clever signs and chants like “The oceans are rising, and so are we”, “Science, not Silence”, and “We’re nerds, we’re wet, we’re really quite upset” (it rained on a lot of marches on Saturday) echoing around the globe, Saturday’s Marches for Science were a cathartic release of energy, a celebration of like-minded people.

Our competition room for NOSB 2017! Game officials are in the front of the picture, competitors at the first two desks, and parents, coaches and supporters in the back.

While millions of enthusiastic people were marching through the streets, I “Ran for Science” at the 20th annual National Ocean Science Bowl (NOSB) – delivering question sheets and scores between competitors and graders as 25 teams competed for the title of national champion! Over the course of the competition, teams of four high school students compete through rounds of buzzer-style multiple choice questions, worksheet style team challenge questions, and the Scientific Expert Briefing, a mock congressional hearing where students present science recommendations on a piece of legislation.  The challenges are unified with a yearly theme, which in 2017 was Blue Energy: powering the planet with our ocean.  Watching the students (representing 33 states!) compete is exciting and inspiring, because they obviously know the material, and are passionate about the subject matter.  Even more encouraging though, is realizing that not all of them plan to look for jobs as research scientists. Some express interest in the arts, some in policy, or teaching or engineering. This competition is not just about fostering the next generation of leading marine scientists, but rather about creating an ocean-literate, and scientifically-literate populace.  So, congratulations to Santa Monica High School, who took home the national title for the first time this year! Would you like to test your knowledge against some of the questions they faced? Try your luck here!

Santa Monica competes in the final round

The GEMM Lab also recently participated in the Hatfield Marine Science Center’s Marine Science Day.  It’s an annual open house where the community is invited to come tour labs, meet scientists, get behind the scenes, and learn about all the exciting research going on.  For us as researchers, it’s a great day to practice explaining our work and its relevance to many different groups, from school children to parents and grandparents, from artists to fishermen to teachers, fellow researchers, and many others.  This year the event attracted over 2,000 people, and the GEMM Lab was proud to be a part of this uniquely interactive day.  Outreach events like this help us feel connected to our community and the excitement present in all the questions field during this event reassure us that the public still cares about the work that we do.

Lab members Florence, Leila, and Dawn (L to R) answer questions from the public.

Our science is interdisciplinary, and we recognize the strength of multiple complimentary avenues of action to affect change.  If you are looking to get involved, consider taking a look at these groups:

500 Women Scientists: “working to promote a diverse and inclusive scientific community that brings progressive science-based solutions to local and global challenges.” Read their take on the March for Science.

314Action: starting from Pi (3.14), their mission is “to (1) strengthen communication among the STEM community, the public and our elected officials, (2) Educate and advocate for and defend the integrity of science and its use, (3) Provide a voice for the STEM community on social issues, (4) Promote the responsible use of data driven fact based approaches in public policy and (5) Increase public engagement with the STEM Community through media.”

She should run: “A movement working to create a culture that inspires women and girls to aspire towards public leadership. We believe that women of all backgrounds should have an equal shot at elected leadership and that our country will benefit from having a government with varied perspectives and experiences.” https://peoplesclimate.org/

And finally, The March for Science is finishing up it’s week of action, culminating in the People’s Climate March on April 29.

How will you carry the cause of science forward?
 

Celebrating Hydrothermal Vents!

By Florence Sullivan, MSc Student OSU

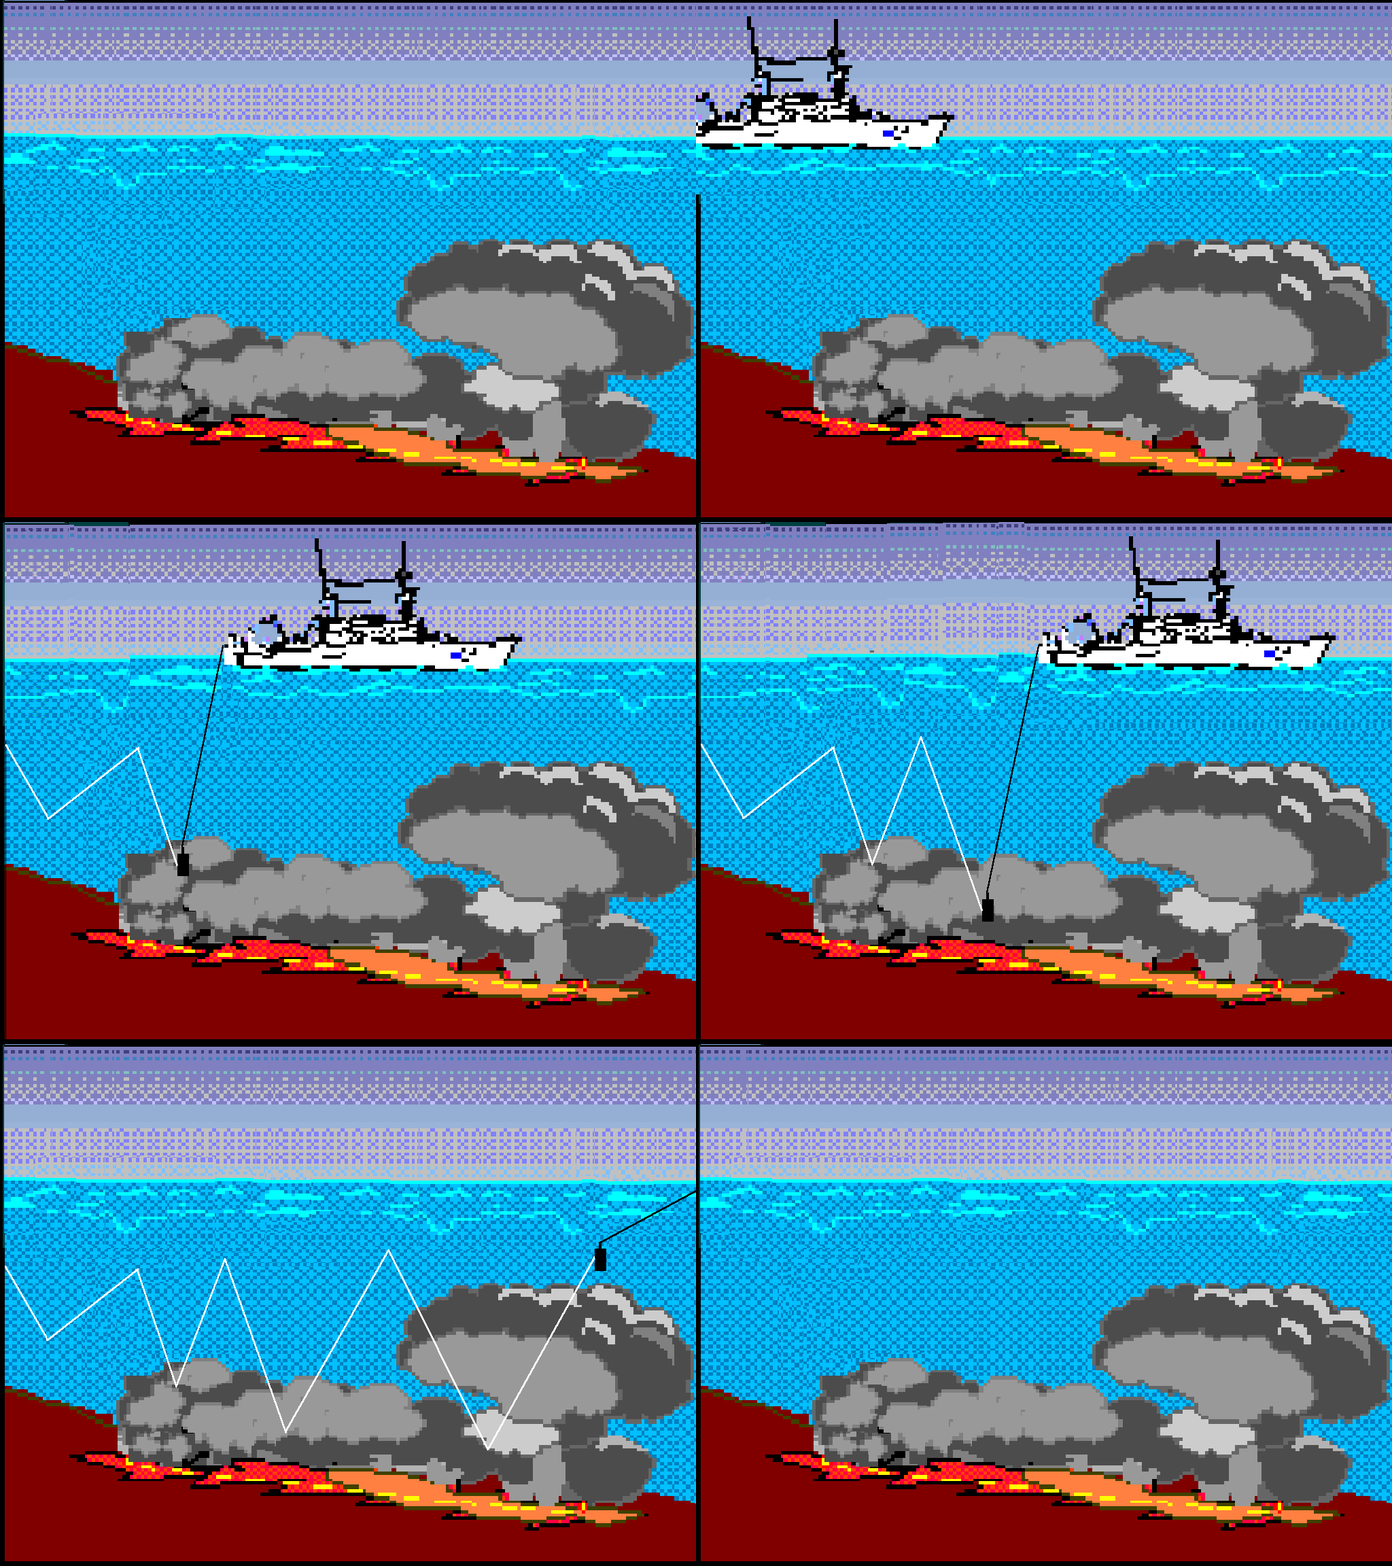
40 years ago, in 1977 OSU researchers led an NSF funded expedition to the Galapagos on a hunt for suspected hydrothermal vents. From the 1960s to the mid-1970s, mounting evidence such as (1) temperature anomalies found deep in the water column, (2) conduction heat flow probes at mid ocean ridges recording temperatures much lower than expected, (3) unusual mounds found on benthic mapping surveys, and (4) frequent, small, localized earthquakes at mid oceanic ridges, had the oceanographic community suspecting the existence of deep sea hydrothermal vents. However, until the 1977 cruise, no one had conclusive evidence that they existed.  During the discovery cruise at the Galapagos rift, the PI (principle investigator), Dr. Jack Corliss from OSU, used tow-yos (a technique where you drag a CTD up and down through the water in a zig zag pattern – see gif) to pinpoint the location of the hydrothermal vent plume. The team then sent the Deep Submergence Vehicle (DSV) Alvin to investigate and returned with the first photographs and samples from a hydrothermal vent. While discovery of the vent systems helped answer many questions about chemical and heat fluxes in the deep sea, it generated so many new questions that novel fields of study were created in biology, microbiology, marine chemistry, marine geology, planetary science, astrobiology and the study of the origin of life.

 “Literally every organism that came up was something that was unknown to science up until that time. It made it terribly exciting. Anything that came [up] on that basket was a new discovery,” – Dr. Richard Lutz (Rutgers University)

In celebration of this great discovery, OSU’s College of Earth, Ocean and Atmospheric Sciences sponsored a seminar looking at the past, present, and future of hydrothermal vent sciences. Dr. Robert Collier began with a timeline of how the search for hydrothermal vents began, and a commemoration of all the excellent researchers and collaborations between institutions and agencies that made the discovery possible. He acknowledged that such collaborations are often somewhat tense in terms of who gets credit for which discovery, and that while Oregon State University was the lead of the project, it takes a team to get the work done.  Dr. Jack Corliss proudly followed up with a wonderful rambling explanation of how vent systems work, and a brief dip into his ground breaking paper, “An Hypothesis concerning the relationship between submarine hot springs and the origin of life on Earth.” Published in 1981, with co-authors Dr. John Baross and Dr. Sarah Hoffman, they postulate that the temperature and chemical gradients seen at hydrothermal vents provide pathways for the synthesis of chemical compounds, formation and evolution of ‘precells’ and eventually, the evolution of free living organisms.

Dr. Corliss, Dr. Baross, and Dr. Hoffman were the first to suggest the now popular theory of the origin of life at hydrothermal vents. (click on image to read full paper)

Because of time constraints, the podium was swiftly handed over to Dr. Bill Chadwick (NOAA PMEL/ HMSC CIMRS) who brought us forward to the present day with an exciting overview of current vent research.  He began by saying “at the beginning, we thought, ‘No one has seen one of these systems before, they must be very rare…’ Now, we have found them [hydrothermal vents] in every ocean basin – including the arctic and southern oceans. We just needed to know how to look!”  Dr. Chadwick also reminded us that even 40 years later, new discoveries are still being made. For example, on his most recent cruise aboard the R/V Falkor in December 2016, they found a sulfur chimney that was alternately releasing bubbles of gas (sulfur, CO2 or other, hard to know without sampling) or bubbles of liquid sulfur! Check out the video below:

Some of the goals for this recent cruise included mapping new areas of the Mariana back-arc, and investigating differences in the biological communities between vents in the Mariana trench region (a subduction zone) and vents in the back arc (a spreading zone) to see if geology plays a role in biological community composition.  For some very cool video footage of the expedition and the various dives performed by the brand new ROV SUBastian (because all scientists love puns), check out the Schmidt Ocean Institute youtube channel.

Dr. Chadwick showed this video to highlight results from his last cruise.

Finally, Dr. Andrew Thurber wrapped up the session with some thoughts about hydrothermal vents from the perspective of an ecosystem services model. Even after 40 years of research, there are still many unknowns about these ecosystems.  Individual vent systems are inherently unique due to their deep sea isolation. However, most explored sites have revealed metals and mineral deposits that have generated a lot of interest from commercial sea floor mining companies. Exploitation of these deposits would be an example of ecosystem “provisioning services” (products that are obtained from the ecosystem). Other examples include the biology of the vents as a source of new genetic material, and the thermal and chemical gradients as natural laboratories that could lead to breakthroughs in pharmaceutical research. Cultural services are those non-material benefits that people obtain from an ecosystem. At hydrothermal vents these include new scientific discoveries, educational uses (British children’s television show “The Octonauts,” has several episodes featuring hydrothermal vent creatures), and creative inspiration for artists and others. Dr. Thurber cautions that there are ethical questions to be answered before considering exploitation of these resources, but there is a lot of potential for commercial and non-commercial use of vent ecosystems.

Vent inspired art by Lily Simonson

As an undergraduate at the University of Washington, I spent time as a research assistant in Dr. John Baross’ astrobiology lab. We studied evolutionary pathways of hydrothermal vent viruses and bacteria to inform the search for life on exoplanets such as Jupiter’s moon Europa.  It was very fun and exciting for me to attend this seminar, hear stories from pioneers in the field, and remember the systems I worked on in undergrad.  I may have moved up the food chain a little now, but as we all work on our pieces of the puzzle, it is important for scientists to remember the interdisciplinary nature of our work, and how there is always something more to learn.


The best field season ever

By Dawn Barlow, MSc student, OSU Department of Fisheries and Wildlife, Geospatial Ecology of Marine Megafauna Lab

8:35pm on February 20th found the blue whale team smiling, singing, and dancing on the aft deck of the R/V Star Keys as the light faded and the sky glowed orange and we marked our final waypoint of the 2017 blue whale field season. What preceded was a series of days so near perfect that we had barely dared dream of the like. Sighting after sighting, and our team of scientists and the wonderful Star Keys crew began to work like a well-oiled machine—approach the whale gently and observe its behavior, fly the drone, deploy the CTD and echosounder, approach for photos, launch the small boat, approach for biopsy, leave the whale, re-apply sunscreen, find another whale, repeat. This series of events continued from sunrise until sunset, when the sky and water were painted brilliant colors. The sound of big blue whale breaths broke the silence over the glassy water, and the plumes of exhaled air lit up in the last bits of sunlight, lingering there without even a puff of wind to blow them away.

A blue whale mother and calf surface in front of Farewell Spit in calm conditions as the daylight starts to fade. Photo by Leigh Torres.
The small boat returns to R/V Star Keys after collecting the final biopsy sample of the season. Photo by Dawn Barlow.

Despite coming to New Zealand during the “worst summer ever”, I’m pleased to say that this has been the most fruitful field season the New Zealand blue whale project has had. We covered a total of 1,635 nautical miles and recorded sightings of 68 blue whales, in addition to sightings of killer whales, pilot whales, common dolphins, dusky dolphins, sharks, and many seabirds. Five of our blue whale sightings included calves, reiterating that the South Taranaki Bight appears to be an important area for mother-calf pairs. Callum and Mike (Department of Conservation) collected 23 blue whale biopsy samples, more than twice the number collected last year. Todd flew the drone over 35 whales, observing and documenting behaviors and collecting aerial imagery for photogrammetry. We took 9,742 photos, which will be used to determine how many unique individuals we saw and how many of them have been sighted in previous years.

A blue whale surfaces with R/V Star Keys in the background. Photo taken from the small boat by Leigh Torres.

It is always hard to see a wonderful thing come to an end, and we agreed that we would all happily continue this work for much longer if funding and weather permitted. But as the small skiff returned to the Star Keys with our final biopsy sample and the dancing began, we all agreed that we couldn’t have asked for a better note to end on. There has already been plenty of wishful chatter about future field efforts, but in the meantime we’re still floating from this year’s success. I will certainly have my hands full when I return to Oregon, and in the best possible way. It feels good to have an abundance of data from a project I’m passionate about.

A blue whale comes up for air in a calm sea. Photo by Leigh Torres.

Thank you to Western Work Boats and Captain James “Razzle-Dazzle” Dalzell, Spock, and Jason of the R/V Star Keys for their hard work, patience, and good attitudes. James made it clear at the beginning of the trip that this was to be our best year ever, and it was nothing less. The crew went from never having seen a blue whale before the trip to being experts in maneuvering around whales, oceanographic data collection, and whale poop-scooping. Thank you to Callum Lilley and Mike Ogle from the Department of Conservation for their time, impressive marksmanship, and enthusiasm. And once again thank you to all of our colleagues, funders, and supporters—this project is made possible by collaboration. Now that we’ve wrapped up, blue whale team members are heading in different directions for the time being. We’ll be dreaming of blue whales for weeks to come, and looking forward to the next time our paths cross.

Blue whale team members in front of R/V Star Keys in port in Nelson.
The team rejoices after a magnificent final survey day!


A day in the office

Join us for a couple boat rides as we study blue whales in the South Taranaki Bight of New Zealand.

In both videos below you can see and hear the field team coordinate to capture photo-identification images of the whale(s) while also obtaining a small tissue biopsy sample. It is important to match the individual whale to the sample so we can link biological data obtained from the sample (genetics, hormones, stable isotopes) to the individual whale. We also carefully take notes on where, when and what we collect in order to help us keep track of our data.

In this video clip you can watch as we gently approach two blues surfacing off the starboard bow of the RV Star Keys in order to capture photo-identification images and a small tissue biopsy sample. Callum Lilley (DOC) on the bow; Leigh Torres, Dawn Barlow, and Todd Chandler (OSU) photographing and coordinating from the flying bridge.


We are in the small boat here collecting data on a pair of blue whales. Callum Lilley (DOC) is on the rifle; Leigh Torres (OSU) is on the camera and taking notes; Todd Chandler (OSU) is on the helm.


I love it when a plan comes together

By Dr. Leigh Torres

GEMM Lab

After four full-on days at sea covering 873 nautical miles, we are back in port as the winds begin to howl again and I now sip my coffee with a much appreciated still horizon. Our dedicated team worked the available weather windows hard and it paid off with more great absence data and excellent presence data too: blue whales, killer whales, common dolphins, and happily swimming pilot whales not headed to nearby Farewell Spit where a sad, massive stranding has occurred. It has been an exhausting, exhilarating, frustrating, exciting, and fulfilling time. As I reflect on all this work and reward, I can’t help but feel gratified for our persistent and focused planning that made it happen successfully. So, as we clean-up, organize data, process samples, and sit in port for a few days I would like to share some of our highlights over the past four days. I hope you enjoy them as much as we did.

The team in action on the RV Star Keys. Callum Lilley (DOC) on the bow waiting for a biopsy opportunity, Dawn Barlow (OSU) on the radio communicating with the small boat, Kristin Hodge (Cornell) taking photos of whales, Captain James Dalzell (Western Work Boats) on the helm, and Chief Engineer Spock (Western Work Boats) keeping his eyes peeled for a blow. (Photo credit: L. Torres)


In the small boat off looking for whales in a lovely flat, calm sea with an oil rig in the background. (Photo credit: D. Barlow)


Small boat action with Todd Chandler (OSU) at the helm, Leigh Torres (OSU) on the camera getting photo-id images, and Callum Lilley (DOC) taking the biopsy shot, and the dart is visible flying toward the whale in the black circle. (Photo credit: D. Barlow)


The stars of the show: blue whales. A photograph captured from the small boat of one animal fluking up to dive down as another whale surfaces close by. (Photo credit: L. Torres)


Collecting oceanographic data: Spock and Jason (Western Work Boats) deploy the CTD from the Star Keys. The CTD is an instrument that measures temperature, salinity, fluorescence and depth continuously as it descends to the bottom and back up again. (Photo credit: L. Torres)


The recently manufactured transducer pole in the water off the RV Star Keys (left) deployed with the echosounder to collect prey availability data, including this image (right) of krill swarms near feeding blue whales. (Photo credit: L. Torres)


The small boat returns to the Star Keys loaded with data and samples, including a large fecal sample in the net: The pooper scooper Leigh Torres (OSU), the biopsy rifle expert Callum Lilley (DOC), and the boat operator Todd Chandler (OSU). (Photo credit: D. Barlow)


Drone operator and videographer, Todd Chandler (OSU) under the towel (crucial piece of gear) to minimize glare on the screen as he locates and records blue whales. (Photo credit: K. Hodge)


A still shot captured from the drone footage of two adult blue whales surfacing in close proximity. (Photo credit: T. Chandler)


The team in action looking for blue whales in ideal survey conditions with Mt. Taranaki in the background. Todd Chandler (OSU) enters survey data while Dawn Barlow (OSU) spies for whale blows. (Photo credit: L. Torres)


A late evening at-sea after a big day sees Callum Lilley (DOC) processing a blue whale biopsy sample for transport, storage and analysis. (Photo credit: K. Hodge)


And we can’t forget why so many have put time, money and effort into this project: These blue whales are feeding and living within a space exploited by humans for multiple purposes, so we must ensure minimal impacts to these whales and their sustained health. (Photo credit: D. Barlow)

The worst summer ever!

By Dr. Leigh Torres

Geospatial Ecology of Marine Megafauna Lab

“This is the worst summer ever in New Zealand.” During our four days of prep in Wellington before heading off on our vessel, almost all my friends and colleagues I spoke to said this statement (often with added emphasis). It’s been cold and windy here all summer long, and when the weather has cleared it has brought only brief respite. These comments don’t bode well for our blue whale survey dependent on calm survey conditions, but February is typically the prime month for good weather in New Zealand so I’m holding out hope. And this unpredictable weather is the common denominator of all field work. Despite months (years?) of preparation, with minute attention to all sort of details (e.g., poop net handle length, bag size limits, length of deployment lines), one of the most important factors to success is something we have absolutely no control over: the weather.

After just one day on the water, I can see that the oceanographic conditions this year are nothing like the hot-water El Niño conditions we experienced last summer. Surface water temperatures today ranged between 12.8 and 13.6 ⁰C. These temps are 10 degrees (Celsius) cooler than the 22 ⁰C water we often surveyed last summer. 10 degrees! Additionally, the current windy conditions have stirred up the upper portion of the ocean water column causing the productive mixed layer to be much deeper (therefore larger) than last year. While Kiwis may complain about the ‘terrible’ weather this summer, the resulting cold and productive oceanographic conditions are likely preferable for the whales. But where are the whales and can we find them with all this wind?

Today we had a pocket of calm conditions so our dedicated research team and crew hit it with enthusiasm, and collected a whole lot of great absence data. “Absence data?” you may ask. Absence data is all the information about where the whales are not, and is just as important as presence data (information about where the whales are) because it’s the comparison between the two sets of data (Presence vs Absence) that allows us to describe an animal’s “habitat use patterns”. Today we surveyed a small portion of the South Taranaki Bight for blue whales for about 6 hours, but the only blue animals we saw were little blue penguins and a blue shark (plus fur seals, dolphins, albatrosses, shearwaters, gannets, prions, kahawai, and saury).  But during this survey effort we collected a lot of synoptic environmental data to describe these habitats, including continuous depth and temperature data along our track, nine CTD water column profiles of temperature, salinity and florescence (productivity) from the surface to the seafloor, and continuous prey (zooplankton) availability data with our transducer (echosounder).

So, now that we have absence data, we need presence data. But, the winds are howling again and are predicted to continue for the next few days. As we hunker down in a beautiful protected cove I know the blue whales continue to search this region for dense food patches, unencumbered by human-perceived obstacles of high wind and swell. So, while my Kiwi friends are right – this summer is not like previous years – I also know that it is the effects of these dynamic weather patterns that we have come so far, and worked so hard, to study. Even as my patience wears thin and my frustrations mount, I will continue to wait to pounce on the right weather window to collect our needed presence data (and more absence data too, I’m sure).

Our research team collecting absence data aboard the RV Star Keys:

GEMM Lab 2016: A Year in the Life

By Dawn Barlow, MSc Student, Department of Fisheries and Wildlife, Oregon State University

The year is rapidly coming to a close, and what a busy year it has been in the Geospatial Ecology of Marine Megafauna Lab! In 2016, our members have traveled to six continents for work (all seven if we can carry Rachael’s South African conference over from the end of 2015…), led field seasons in polar, temperate, and tropical waters, presented at international conferences, processed and analyzed data, and published results. Now winter finds us holed up in our offices in Newport, and various projects are ramping up and winding down. With all of the recent turmoil 2016 has brought, it is a nice to reflect on the good work that was accomplished over the last 12 months. In writing this, I am reminded of how grateful I am to work with this talented group of people!

The year started with a flurry of field activity from our southern hemisphere projects! Erin spent her second season on the Antarctic peninsula, where she contributed to the Palmer Station Long Term Ecological Research Project.

Erin collecting a crabeater seal scat sample.
Erin in action collecting a crabeater seal scat sample along the West Antarctic Peninsula.


Aerial image of the research vessel and a pair of blue whales during the 2016 New Zealand survey.

The New Zealand blue whale project launched a comprehensive field effort in January and February, and it was a fruitful season to say the least. The team deployed hydrophones, collected tissue biopsy and fecal samples, and observed whales feeding, racing and nursing. The data collected by the blue whale team is currently being analyzed to aid in conservation efforts of these endangered animals living in the constant presence of the oil and gas industry.

Midway atoll is home to one of the largest albatross colony in the world, and Rachael visited during the winter breeding season. In addition to deploying tracking devices to study flight heights and potential conflict with wind energy development, she became acutely aware of the hazards facing these birds, including egg predation by mice and the consumption of plastic debris.

Laysan albatross equipped with a GPS data logger.
Fledgling from last year with a stomach full of plastic.

Early summertime brought red-legged kittiwakes to the remote Pribilof Islands in Alaska to nest, and Rachael met them there to study their physiology and behavior.

Rachael with a noosepole on St. George Island, Alaska
Solene with Dr. Claire Garrigue during fieldwork at the Chesterfield Reefs, New Caledonia.

As the weather warmed for us in the northern hemisphere, Solene spent the austral winter with the humpback whales on their breeding grounds in New Caledonia. Her team traveled to the Chesterfield Reefs, where they collected tissue biopsy samples and photo-IDs, and recorded the whale’s songs. But Solene studies far more than just these whales! She is thoroughly examining every piece of environmental, physical, and oceanographic data she can get her hands on in an effort to build a thorough model of humpback whale distribution and habitat use.

A humpback whale in New Caledonia's South Lagoon.
A humpback whale in New Caledonia’s South Lagoon.

Summertime came to Oregon, and the gray whales returned to these coastal waters. Leigh, Leila, and Todd launched into fieldwork on the gray whale stress physiology project. The poop-scooping, drone-flying team has gotten a fair bit of press recently, follow this link to listen to more!

The overhead drone captures a pair of gray whales surfacing between kelp beds off Cape Blanco, Oregon, with the research vessel nearby. Take under NOAA/NMFS permit #16111 given to John Calambokidis.

And while Leigh, Leila, and Todd followed the grays from the water, Florence and her team watched them from shore in Port Orford, tracking their movement and behavior. In an effort to gain a better understanding of the foraging ecology of these whales, Florence and crew also sampled their mysid prey from a trusty research kayak.

13
Florence and the summer 2016 gray whale field team.
DSCF0758
Kelli Iddings sampling mysid near Port Orford.

With the influx of gray whales came an influx of new and visiting GEMM Lab members, as Florence’s team of interns joined for the summer season. I was lucky enough to join this group as the lab’s newest graduate student!

All summer 2016 GEMM Lab members.
All of the summer 2016 GEMM Lab members.

Our members have presented their work to audiences far and wide. This summer Leigh, Amanda, and Florence attended the International Marine Conservation Congress, and Amanda was awarded runner-up for the best student presentation award! Erin traveled to Malaysia for the Scientific Convention on Antarctic Research, and Rachael and Leigh presented at the International Albatross and Petrel Conference in Barcelona. With assistance from Florence and Amanda, Leigh led an offshore expedition on OSU’s research vessel R/V Oceanus to teach high school students and teachers about the marine environment.

Amanda with her award!
Science Party musters in the dry lab for safety debrief aboard R/V Oceanus.

Courtney fledged from the GEMM Lab nest before 2016 began, but the work she did while here was published in Marine Mammal Science this year. Congrats Courtney! And speaking of publications, additional congratulations to Solene for her publication in Marine Ecology Progress Series, Rachael for her four publications this year in PLOS ONE, Marine Ecology Progress Series, Marine Ornithology, and the Journal of Experimental Biology, and Leigh for her five publications this year in Polar Biology, Diversity and Distributions, Marine Ecology Progress Series, and Marine Mammal Science!

Wintertime in Newport has us tucked away indoors with our computers, cranking through analyses and writing, and dreaming about boats, islands, seabirds, and whales… Solene visited from the South Pacific this fall, and graced us with her presence and her coding expertise. It is a wonderful thing to have labmates to share ideas, frustrations, and accomplishments with.

No heat in the lab can't stop us from solving a coding problem together on a wintery evening!
Solving a coding problem together on a wintery evening.

As the year comes to a close, we have two newly-minted Masters of Science! Congratulations to Amanda and Erin on successfully defending their theses, and stay tuned for their upcoming publications!

Amanda's post-defense celebration!
Amanda’s post-defense celebration!
Erin's post-defense celebration!
Erin’s post-defense celebration!

We are looking forward to what 2017 brings for this team of marine megafauna enthusiasts. Happy holidays from the GEMM Lab!

Happy GEMM Lab members.
Happy GEMM Lab members, enjoying one another’s company and playing Evolution.

Dredging and low visibility doesn’t stop us! We paddle on.

By: Catherine Lo, Research Intern, Oregon State University ‘16

Hello everyone! My name is Catherine Lo and I am a recent graduate from Oregon State University with a Bachelor’s of Science in Biology with a focus in Marine Biology. It has been an incredible whirlwind leading up to this point: long nights studying for finals, completing my degree, and planning the next steps for my future. I am fortunate to be working as a summer research intern for the GEMM Lab under the supervision of Dr. Leigh Torres and Msc. student Florence Sullivan in their research on the foraging ecology of gray whales. I have dreamed of working with marine mammals, potentially as a research veterinarian and so, capturing this position has been a great opportunity to begin my career.

The days go slow, but the weeks go fast. It’s already week 4 of our field season and the team and I are definitely in the groove of our research. The alarm(s) goes off at 5:00 AM…okay maybe closer to 5:30 AM (oops!), getting dressed for either the kayak or cliff based work, scarfing down breakfast that is usually a diet consisting of toast and peanut butter, and then heading off to the beach to launch the kayak. But this week it was different. A dredging event in Port Orford coordinated by the US Army Corps of Engineers is now taking place right next to the port’s jetty near our study site (Figure 1). This is an important process to move the sediment built up during the year in order for ships to safely navigate in and out of the port. We knew this was going to happen at some point over the summer, and worried that it might impact our research methods and objectives, but at the same time it offers some new opportunities: the chance to see how our GoPro and mysid sampling methods in Tichenor Cove are impacted by the sediment flow from the dredging activities.

_EM_0007
Figure 1. View of the dredger from the cliff field site in Port Orford.

My teammate Kelli and I were stationed on the cliff during the first deposit of sediment after the dredge’s first night and morning’s worth of scooping sand. None of us knew where the actual deposit site would be so we kept a good eye on it. The ship headed past the jetty. Turned around and, as a concerned feeling mustered within our field team, it began lowering the platform holding the sand just 250 yards away from our primary study site in Tichenor Cove! At this point, we knew things were going to be different in our samples. Unfortunately along with the sediment stirring up from dredging, we think a phytoplankton bloom is occurring simultaneously. Our GoPro footage lately has been rather clouded making it difficult to identify any mysid relative to our past footage. You can compare Figure 2 to the GoPro image found in Figure 2 of a previous post. It is times like these that we learn how dynamic the ocean is, how human activity can alter the ocean ecosystem, and how to adapt to changes, whether these adaptations are within our reach or not. We are interested to see how our sample sites will change again over time as the dredging operation finishes and the phytoplankton bloom ends.

Figure 2. This GoPro image taken in Tichenor Cove illustrates exactly how murky our view of the water column is with the sediment dredging operation in close proximity.

Aside from the current water clarity situation, we’ve also had some exciting moments! Given how few whales we’ve seen thus far and how the ones we have tracked are predominately hanging by Mill Rocks, which is ~1km east of Tichenor Cove, Dr. Leigh Torres—our head advisor—thought it would be a good idea to check out the mysid scene over there to see what the attraction was. So, we sent our kayak team over there to conduct a few GoPro drops and zooplankton net tows and figure out what is so enticing for the whales.

While conducting this sampling work at Mill Rocks, I and my teammate were lucky enough to encounter a gray whale foraging. And believe me, we were going “off-the-walls” as soon as we heard from the cliff team and saw a blow as the whale surfaced nearby. It was one of those “best time of my life” moments where my dreams of kayaking this close to a whale came true. We fumbled around for our waterproof camera to get clear shots of its lateral flanks for photo identification while also trying to contain our excitement to a more decent level, and at the same time we had to make sure we were not in the whale’s path. There it was; surface after surface, we admired the immense size and beauty of a wild animal before our eyes. The worst part of it was when our camera battery died not long after taking a few pictures, but in a way it gave us a chance to really appreciate the existence of these animals. Note to self during research: always check your batteries are fully charged before heading out!

It baffles me how so often people walk along beaches or drive by without knowing an animal as incredible as this whale is just outside of the shoreline. Every time I’m inside pulling out time stamps or doing photo identification, I always think, “I wonder if there’s a whale in Tichenor Cove or at Mill Rocks right now…Yeah, there probably is one”. Alas, the data management work needs to be done and there’s always the next day for an opportunity of a sighting.

For a few days, our kayak team wasn’t able to work due to a small craft advisory. If you’ve ever been to Port Orford, you’d understand the severity of how windy it gets here. Ranging between 15 knots to 25 knots as early as 7am, so it gets rather difficult to maintain position at each of our sampling stations in our kayak. Fortunately our cliff team was able to set out. We were lucky to see a small whale foraging inside Tichenor Cove and later move onto Mill Rocks. This little one was giving us quite a show! Almost every time it came to the surface, defecation was observed shortly after. As unpleasant as feces might be, it can actually provide an abundance of information about a specific whale including sex, reproductive status, hormone levels, and much more. While doing our research, we are always keeping an eye out for signs of defecation in order to collect samples for another lab member’s PhD work. Here you can check out more information about Leila’s research. Figure 3 depicts a great image of defecation captured by our cliff team.

Figure 3. Gray whale defecating as it dives into the water in Tichenor Cove.
Figure 4. Gray whale swimming in Tichenor Cove taken by fellow intern Cathryn Wood.

In addition to helping out Leila’s work, we recently began a collaboration with Aaron Galloway from The Oregon Institute of Marine Biology (OIMB). Aaron and his post-doc are looking at the fatty acid composition of mysid as an approach to eventually infer the diet of an aquatic animal. Check out his website which is linked to his name to learn more about the basis of his approach! While we collect mysid samples for them, in return they give us substantial information about the energy content of the mysid. This information on the energetic content of mysid will help the GEMM Lab answer questions about how much mysid gray whales need to eat.

Oregon State University and University of Oregon have a long-standing, intense rivalry. However, as an Alumna from Oregon State, I am amazed and thrilled to see how these two institutions can come together and collaborate. I mean, we’re all here for the same thing. Science, right? It creates the opportunity to apply integrative research by taking advantage of various expertise and resources. If we have those chances to reach out to others, why not make the most of it? In the end, sound science is what really matters, not rooting for the ducks or beavers.

My marine science background is based on my experiences looking at tidepools and hopping around on rocks to understand how vast intertidal communities range from invertebrates to algae. These experiences were an incredible part of my life, but now I look at the ocean unsure of what animals or environmental situations I might encounter. That’s what makes it so attractive. Don’t get me wrong. The intertidal will always hold a special place in my heart, but the endless possibilities of being a part of this marine mammal research team is priceless. I have learned so much about myself including my strengths and weaknesses. Living in Port Orford, which is a small coastal town with just a little over 1,000 people gives you a new perspective. The community has been very welcoming and I have appreciated how so much interest is placed on the kind of work we do. As I eat my nightly bowl of ice cream, I think about how, from here on out, the good and the bad can only bring a lifetime of skills and memories.

Figure 5. Me being extremely happy to be out on the kayak on a beautiful morning.


From the highs to the lows, that’s just how it blows!


By: Kelli Iddings, MSc Student, Duke University, Nicholas School of the Environment

The excitement is palpable as I wait in anticipation. But finally, “Blow!” I shout as I notice the lingering spray of seawater expelled from a gray whale as it surfaces to breathe. The team and I scurry about the field site taking our places and getting ready to track the whale’s movements. “Gray whale- Traveling- Group 1- Mark!” I exclaim mustering enough self-control to ignore the urge to drop everything and stand in complete awe of what in my mind is nothing short of a miracle. I’ve spotted a gray whale searching and foraging for food! As a student of the Master of Environmental Management program at Duke University, I am collaborating on a project in Port Orford, Oregon where my team and I are working to gain a better understanding of the interactions between the Pacific Coast Feeding Group (PCFG) gray whales and their prey. Check out this blog post written earlier by my teammate Florence to learn more about the methods of the project and what motivated us to take a closer look at the foraging behavior of this species.

Understanding the dynamics of gray whale foraging within ecosystems where they are feeding is essential to paint a more comprehensive picture of gray whale health and ecology—often with the intent to protect and conserve them. A lot of our recent effort has been focused on developing and testing methods that will allow us to answer the questions that we are asking. For example, what species of prey are the PCFG whales feeding on in Port Orford? Based on the results of a previous study (Newell and Cowles 2006) that was conducted in Depoe Bay, Oregon, and a lot of great knowledge from the local fisheries and the Port Orford community, we hypothesized that the whales were feeding on a small, shrimp-like crustacean in the order Mysida. Given the results of our videos, and the abundance of mysid, it looks like we are right (Fig. 1)!

DSCF0776[3]
Figure 1: Mysids, only 5-25mm in length, collected in Tichenor Cove using a downrigger to lower a weighted plankton net into the water column from our kayak.
Mysids are not typically the primary food source of gray whales. In their feeding grounds in the Bering and Chukchi Seas near Alaska, the whales feed on benthic amphipods on the ocean floor by sucking up sediment and water and pushing it through baleen plates that trap the food as the water and sediment is filtered out. However, gray whales demonstrate flexible feeding strategies and are considered opportunistic feeders, meaning they are not obligate feeders on one prey item like krill-dependent blue whales. In Oregon, mysid congregate in dense swarms by the billions, which we hypothesize, makes it energetically worthwhile for the massive 13-15m gray whales to hang around and feed! Figure 2 illustrates a mysid swarm of this kind in Tichenor Cove.

DCIM102GOPROG0132732.
Figure 2: Image captured using a Hero 4 Black GoPro. Rocky Substrate is visible in lower portion of image and a clear swarm of mysid is aggregated around this area.

Once we know what the gray whales are eating, and why, we ask follow up questions like how is the distribution of mysid changing across space and time, if at all? Are there patterns? If so, are the patterns influencing the feeding behavior and movement of the whales? For the most part, we are having success characterizing the relative abundances of mysid. No conclusions can be made yet, but there are a few trends that we are noticing. For instance, it seems that the mysid are, as we hypothesized, very dense and abundant around the rocky shoreline where there are kelp beds. Could these characteristics be predictors of critical habitat that whales seek as foraging grounds? Is it the presence of kelp that mysid prefer? Or maybe it’s the rocky substrate itself? Distance to shore? Time and data analysis will tell. We have also noticed that mysid seem to prefer to hang out closer to the bottom of the water column. Last, but certainly not least, we are already noticing differences in the sizes and life stages of the mysid over the short span of one week at our research site! We are excited to explore these patterns further.

The biggest thing we’re learning out here, however, is the absolute necessity for patience, ingenuity, adaptability, and perseverance in science. You heard that right, as with most things, I am learning more from our failures, than I am from our successes.  For starters, understanding mysid abundance and distribution is great in and of itself, but we cannot draw any conclusions about how those factors are affecting whales if the whales don’t come! We were very fortunate to see whales while training on our instruments in Newport, north of our current study site. We saw whales foraging, whales searching, mother/calf pairs, and even whales breaching! Since we’ve been in Port Orford, we have seen only three whales, thrown in among the long hours of womanpower (#WomenInScience) we have been putting in! We are now learning the realities of ecological science that >gasp< fieldwork can be boring! Nevertheless, we trust that the whales will hear our calls (Yes, our literal whale calls. Like I said, it can get boring up on the cliff) and head on over to give the cliff team in Port Orford some great data—and excitement!

Then, there is the technology. Oh, the joys of technology. You see I’ve never considered myself a “techie.” Honestly, I didn’t even know what a hard drive was until some embarrassing time in the not-so-distant past. And now, here I am working on a project that is using novel, technology rich approaches to study what I am most passionate about. Oh, the irony. Alas, I have been putting on my big girl britches, saddling up, and taking the whale by the fluke. Days are spent syncing a GoPro, Time-Depth Recorder (TDR), GPS, associated software, and our trusty rugged laptop, all the while navigating across multiple hard drives, transferring and organizing massive amounts of data, reviewing and editing video footage, and trouble shooting all of it when something, inevitably, crashes, gets lost, or some other form of small tragedy associated with data management. Sounds fun, right? Nonetheless, within the chaos and despair, I realize that technology is my friend, not my foe. Technology allows us to collect more data than ever before, giving us the ability to see trends that we could not have seen otherwise, and expending much less physical effort doing so. Additionally, technology offers many alternatives to other invasive and potentially destructive methods of data collection. The truth is if you’re not technologically savvy in science these days, you can expect to fall behind. I am grateful to have an incredible team of support and such an exciting project to soften the blow. Below (Fig. 3) is a picture of myself embracing my new friend technology.

DSCF0758
Figure 3: Retrieving the GoPro, and some tag-a-long kelp, from the water after a successful deployment in Tichenor Cove.

Last but not least, there are those moments that can best be explained by the Norwegian sentiment “Uff da!” I was introduced to the expression while dining at The Crazy Norwegian, known famously for having the best fish and chips along the entire west coast and located dangerously close to the field station. The expression dates back to the 19th century, and is used readily to concisely convey feelings of surprise, astonishment, exhaustion, and sometimes dismay. This past week, the team was witness to all of these feelings at once as our GoPro, TDR, and data fell swiftly to the bottom of the 42-degree waters of Tichenor cove after the line snapped during deployment. Uff da!!! With our dive contact out of town, red tape limiting our options, the holiday weekend looming ahead, and the dreadful thought of losing our equipment on a very tight budget, the team banded together to draft a plan. And what a beautiful plan it was! The communities of Port Orford, Oregon State University, and the University of Oregon’s Institute of Marine Biology came together in a successful attempt to retrieve the equipment. We offer much gratitude to Greg Ryder, our retrieval boat operator, OSU dive safety operator Kevin Buch, and our divers, Aaron Galloway and Taylor Eaton! After lying on the bottom of the cove for almost three days, the divers retrieved our equipment within 20 minutes of the dive – thanks to the quick and mindful action of our kayak team to mark a waypoint on the GPS at the time of the equipment loss. Please enjoy this shot (Fig. 4) of Aaron and Taylor surfacing with the gear as much as we do!

Figure 4: Aaron Galloway and Taylor Eaton surface with our lost piece of equipment after a successful dive retrieval mission.

The moral of the story is that science isn’t easy, but it’s worth it. It takes hard work, long hours, frustration, commitment, collaboration, and preparedness. But moments come along when your team sits around a dining room table, exhausted from waking and paddling at 5 am that morning, and continues to drive forward. You creatively brainstorm, running on the fumes of the passion and love for the ocean and creatures within it that brought everyone together in the first place; each person growing in his or her own right. Questions are answered, conclusions are drawn, and you go to bed at the end of it all with a smile on your face, anxiously anticipating the little miracles that the next day’s light will bring.

References

Newell, C. and T.J. Cowles. (2006). Unusual gray whale Eschrichtius robustus feeding in the summer of 2005 off the central Oregon Coast. Geophysical Research Letters, 33:10.1029/2006GL027189

Whale mAPP Goes Global!

By Courtney Hann

The Whale mAPP team of Lei Lani Stelle, Melo King of Smallmelo Geographic Information Services, and me (Courtney Hann) has been busy recruiting ocean enthusiasts and applying for grants to fund volunteer-suggested Whale mAPP revisions. As a refresher, Whale mAPP is an Android-based mobile application that can be used by anyone to record marine mammal (whale, dolphins, porpoises, pinniped) sightings around the world. It is easy to sign up as a beta tester on the Whale mAPP website, www.whalemapp.org, and use the mobile app on your personal device to help scientists and conservationists learn more about marine mammals.

What is most spectacular is that the app has truly gone global! We now have over 100 users and are getting a couple new user requests each week! These volunteers have been busy at work this summer, recording thousands of marine mammal sightings during the summer months. Sightings have streamed in from the U.S. West Coast, Hawaiian, Japanese, and Russian waters, the Caribbean, the middle of the Southern Ocean, and the Greenland Sea. You can click on any sighting on the web map to see details about what species were recorded, how many were seen, what their behavior was like, the weather conditions that day, and other notes.

This map shows global marine mammal sightings recorded by Whale mAPP volunteers. The blue whale tale icons represent whale sightings, the pink dolphin icons represent dolphin or porpoise sightings, and the orange seal icon represents a seal, sea lion, or sea otter sighting. Data recorded during each sighting include the location (automatic), the species, the weather and sea conditions, the number of individuals, and a five-star confidence rating (http://www.whalemapp.org/map/#/, CEBCO, DeLorme | Melodi King, MS GIS Program – Cohort 21, University of Redlands).

If we zoom into my particular study area of Southeast Alaska, we see that volunteers are still doing a superb job at recording the abundant number of marine mammals in the area.

Zoomed in image of the northeast Pacific, showing marine mammal sightings recorded this summer in Alaska, Southeast Alaska, British Columbia, and Washington (http://www.whalemapp.org/map/#/, CEBCO, DeLorme | Melodi King, MS GIS Program – Cohort 21, University of Redlands).

Initial funding through the California Coastal Commission Whale Tail grant facilitated the creation of the Whale mAPP project, while current funding from the Hatfield Marine Science Center’s Mamie Markham Research Award that I received this Spring 2015 is funding the top two revisions requested by our users:
(1) Enable the user to edit observations during a trip and after a trip has ended. This revision is huge, was requested by almost every user I spoke to in Southeast Alaska, and was shown very evidently in our survey results.
(2) Add site-specific animal behavior and descriptions to Whale mAPP. For Southeast Alaska, this means adding the famous bubble-net feeding behavior to our list, as well as important descriptions of how to identify, recognize, and understand marine mammal behaviors.
In addition to the above two revisions, a few other revisions will be completed by Smallmelo Geographic Information Services this winter. These revisions include improving world-wide coverage of region-specific species lists, creating tools for validating the quality of the data, enabling data downloads directly from the website (www.whalemapp.org), and including the beta-tested “marine mammal fun facts” into the global application.

All of these incredible accomplishments and progress toward a successful, educational, fun, and data-generating marine mammal citizen science project could not have happened without Dr. Lei Lani’s open mind toward incorporating more people, including me, into her Whale mAPP project. Whale mAPP represents a new age of scientists, one of collaboration across disciplines (ecology, statistics, coding, education, and more!), and one that over-steps previous boundaries to re-define science. I hope that my participation with Whale mAPP and future citizen science projects will inspire individuals to know and feel that they can be scientists and that we can inspire the world to work together for the common good of our oceans.