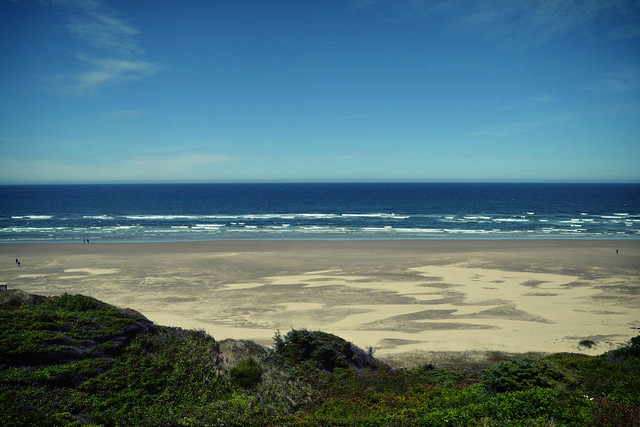
It’s really awesome not being in 90+ degree weather.
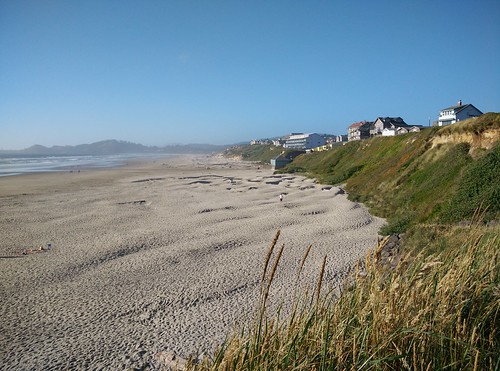
Exhibit A
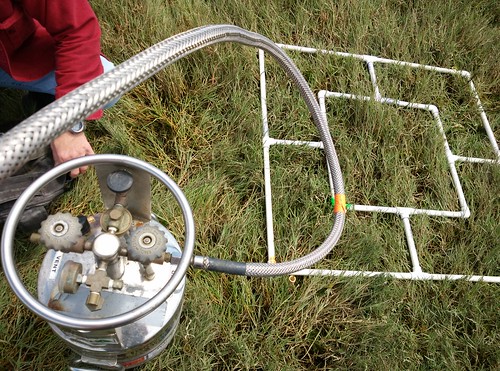
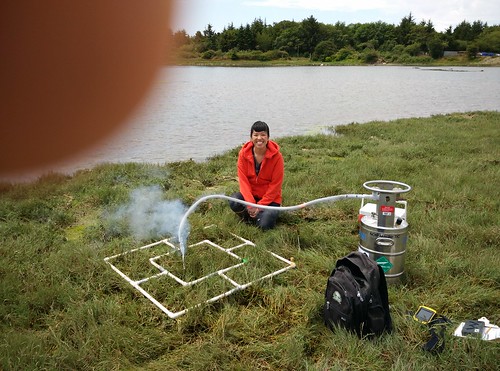
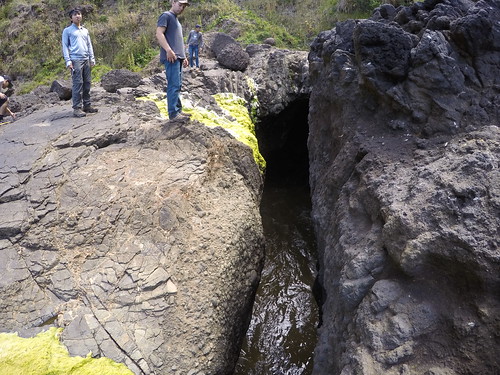
On Monday, some VIP EPA folks came down to the Newport office to poke around to see what our office has been up to (and to escape the heat too, I’m sure). Prior to my involvement/arrival, my mentor had developed a method for testing whether Oregon marshes were “keeping up” with rising tides by looking at marsh accretion. In eight different Oregonian estuaries, marker horizon method sites were implemented. By pouring on feldspar clay onto plots, an initial baseline is set. From then on, any time in the short or long term future a sediment core sample is taken, based on the distance of sediment accretion from the feldspar layer initially laid down, would tell you the amount of accretion happened in that period of time. To showcase the methodology, we drew a sample core from the marsh outside our office to show our visitors. Sediment cores are extracted using liquid nitrogen.
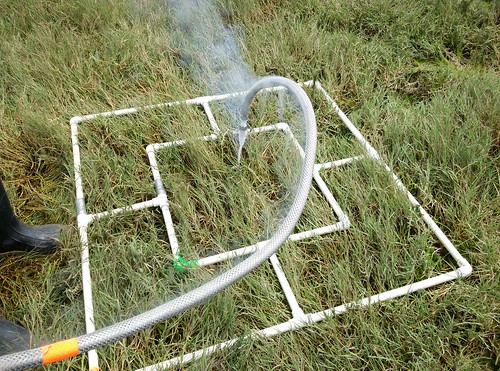
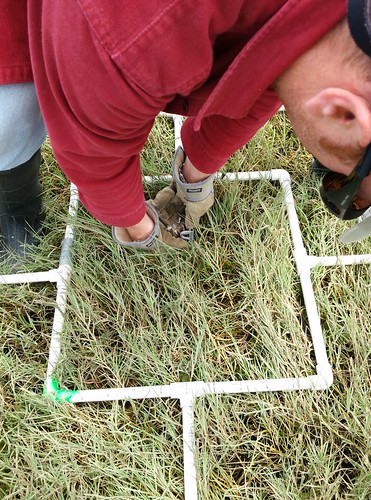
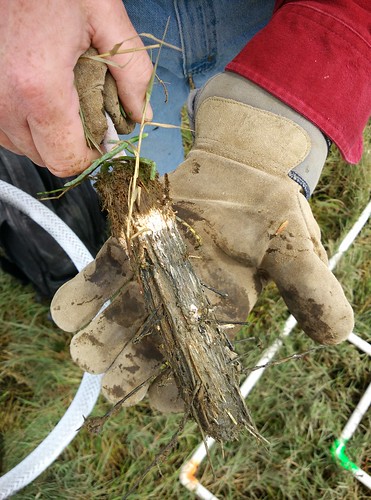
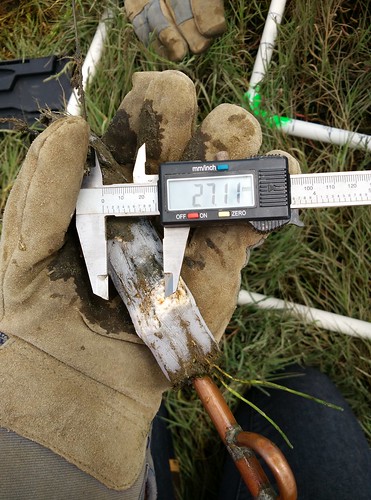

By measuring soil accretion, we can quantify how much marshlands (which are critical habitats for wildlife, responsible for nutrient removal, and other ecosystem services) are being affected by sea level rise. Current estimates suggest a 2-3 mm annual rise. Based on our sample core, we exceeded that estimate– which suggests, the sea level rise is happening and affecting marshlands at a faster rate than predicted.
Something this visual is really valuable in showing those who might not have a science background the kind of issues we’re dealing with. I really liked this method of marshland accretion measurement because it is 1) simple 2) easy 3) effective 4) very visual 5) consistent, which I feel are good characteristics every good study and design should have.
I was only involved with the prep for the core sample demo, and instead, was a part of another demo happening in the lab. A study a post-doc working with Cheryl (my mentor) is working on, is the effects of macroalgae mats on cockle behaviors. It was super cool seeing another visual demonstration. We had a tank set up with a layer of sand and a few cockles doing what they do best– burrowing. While we had the cockles chilling and hanging out, we placed macroalgae mats on the surface of the water, and by inducing a psuedo low-tide (by slowly draining the water from the tank), we were able to observe the cockles’ behavior.
When macroalgae mats descend (!!!!) on cockles, the pressure from the weight of the mats induce the cockles to use their foot to essentially, “escape” and try to push themselves out of the sediment and out of the mats. The study they were presenting was super cool and proved that this behavior was due to pressure changes detected by the cockles, instead of chemical cues or any other factor.
For the rest of the day and the day after, I proceeded to finish my chlorophyll extractions in the fume hood. It’s always disorienting working in a fume hood in subdued/dark settings for a majority of the day and then emerge out of the lab caves and realize it’s still day time. But I love it– lab work is my calling. I hope I’m realizing it’s my calling instead of me going crazy under dark room settings.
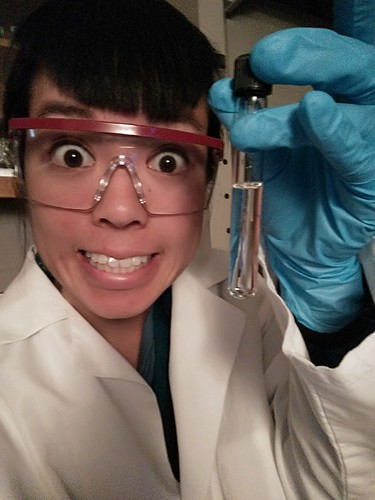
Note: crazy scientist eyes
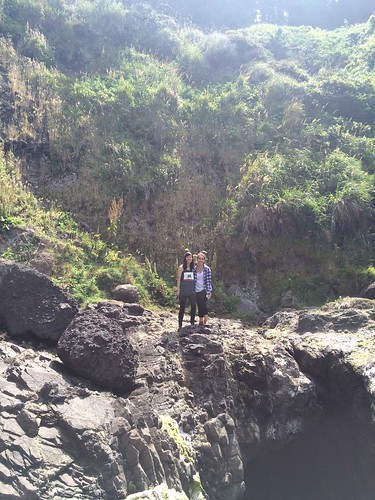
We got to go out to the field this week as well ! Siuslaw estuary is officially my favorite system. Working out in estuaries and seeing the gorgeous never-ending forest landscapes of the PNW, has really convinced me to buy a house boat and live on the waters with my dog.

The night before fieldwork, the interns and I watched Bourne Identity, and I proceeded to have a uncannily similar nightmare soon after. I dreamt I was a fisherwoman on a boat in the Bering Sea and the boat capsized. The next thing I knew I was being pulled out of the waters and rescued with two of my crew. Looking down at my knuckles, I noticed stitches in the shape of an X. I freaked out and my crewmates told me to check the rest of my body. I lifted up my shirt and my crewmates exclaimed there was a branding on my back (Bourne-esque stuff here) and yelled, “DID THEY TAKE YOUR KIDNEYS?!” I then woke up to reality, in a sweat.
Why am I telling you about my weird nightmare?
The beginning of the Siuslaw sample sets were in the marine layer and was very similar to an episode of Deadliest Catch. Except, maybe without all the storms….and the crabs…and the general fishing…and the extreme weathers in general. Maybe it’s wrong for me to compare my not-so-fair weather conditions with one of the riskiest occupations on the waters. But anyhow, there was wind and salt water spraying on my face and the boat was rocking and I was loving it. It was definitely one of the most intense fieldwork I’ve had thus far. It calmed down as we went upriver, so I didn’t have to endure for too long.
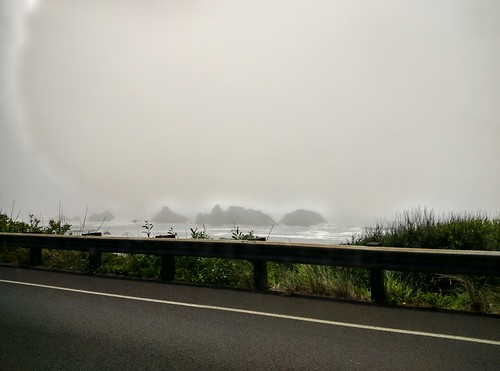
en route to Siuslaw
After fieldwork, the post-doc I work with back home (whom I’ve become super close friends with) ended up moving to Canada this past month, and she surprised me with a phone call to catch up! I thought it was such a coincidence since shortly after the phone call, the interns and I attended a Canada Day get together put on by one of the grad students at Hatfield. It was only appropriate for this cake to make an appearance:
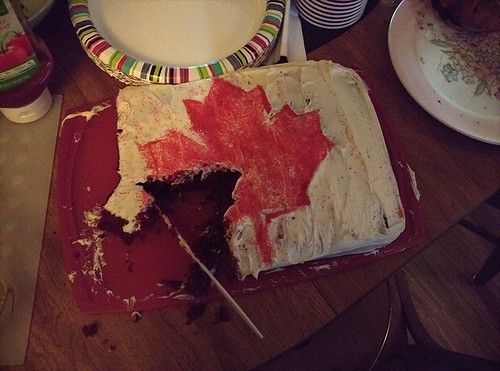
I learned a lot about poutine, Canadian hospitality, and the other grad students at Hatfield. Also, the ratio of dogs to people at this Canada celebration was amazingly high. If Canada is as fun as our Canada Day celebration, I wouldn’t mind spending some time there.
On Thursday, the EPA employees got to leave 2 hours early! Yay federal holidays! Yay working for the feds! Yaaaay!
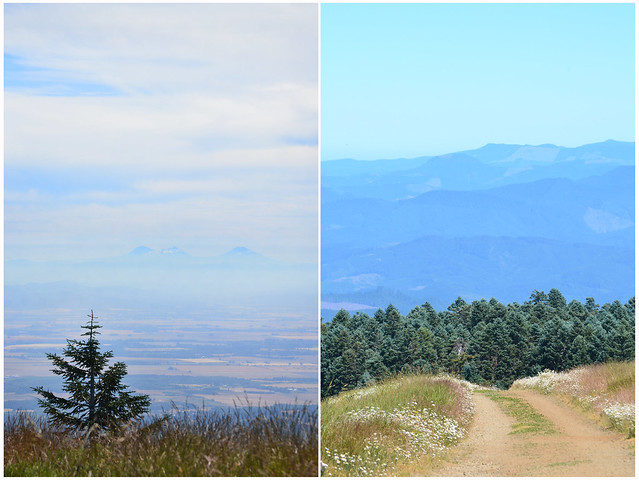
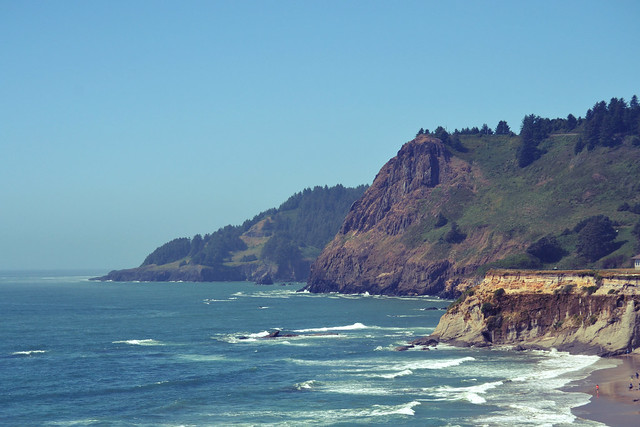
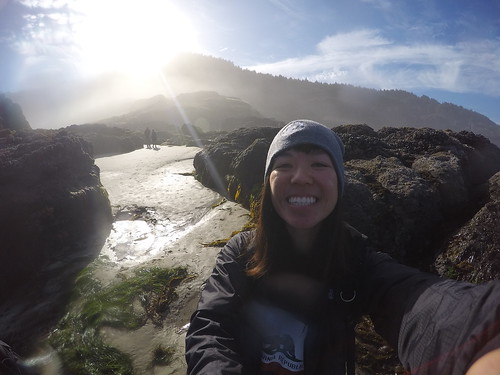
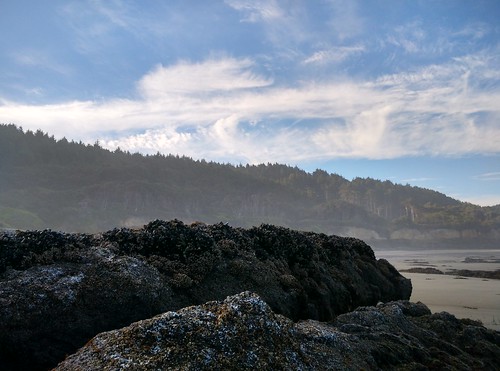
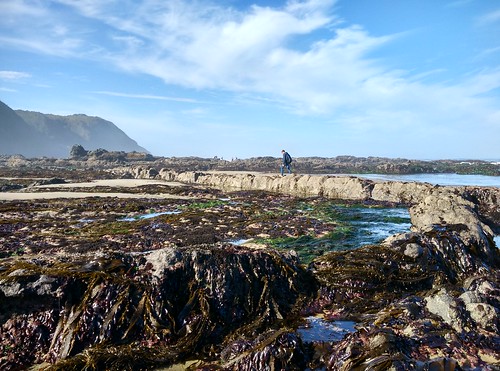
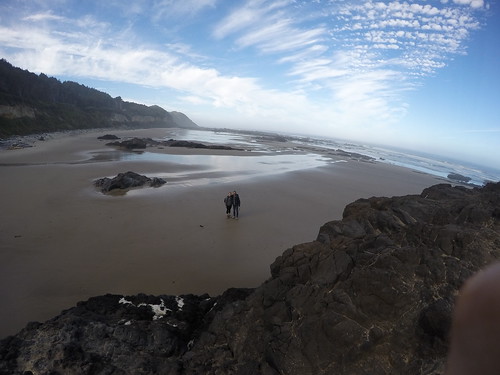
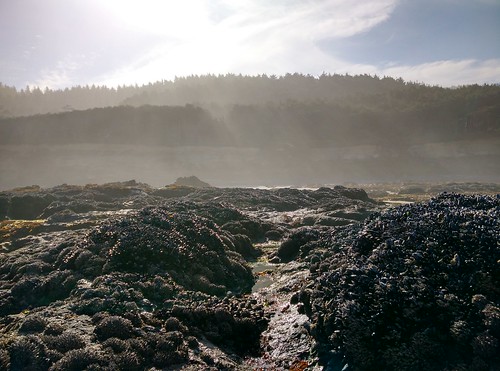
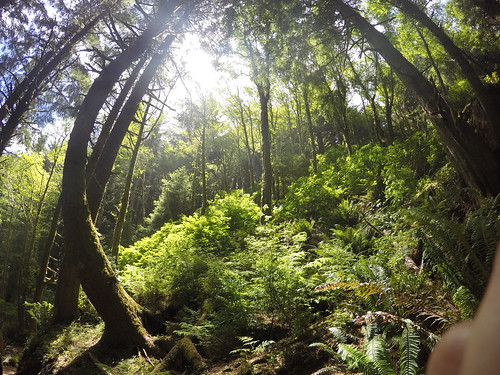
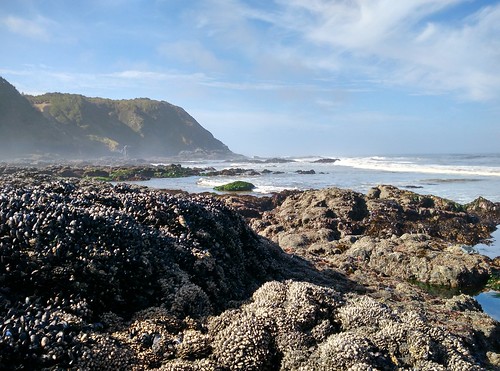
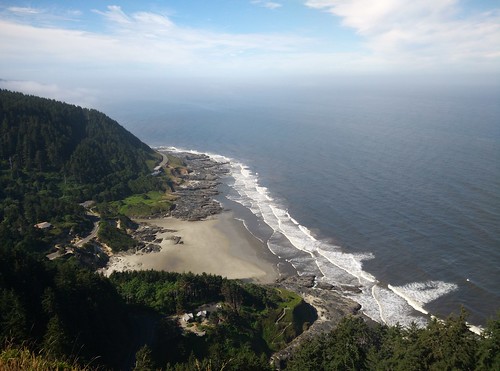
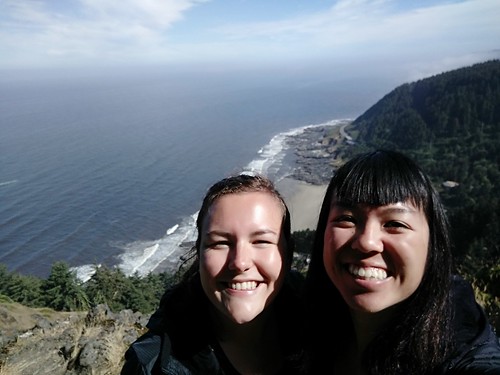
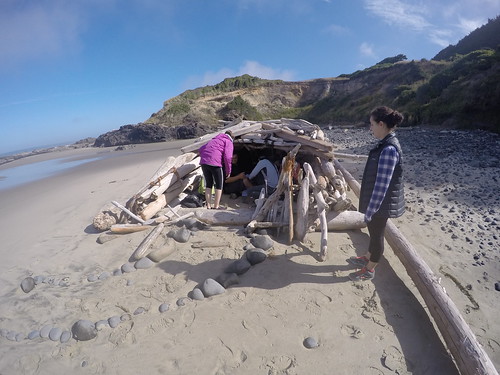
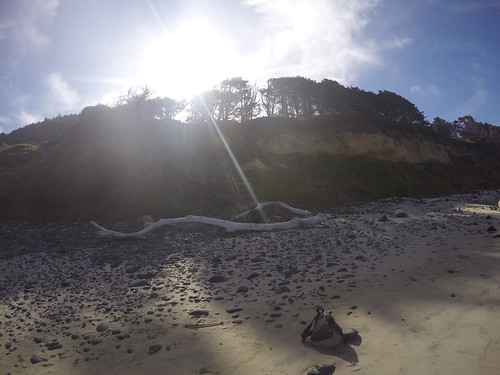
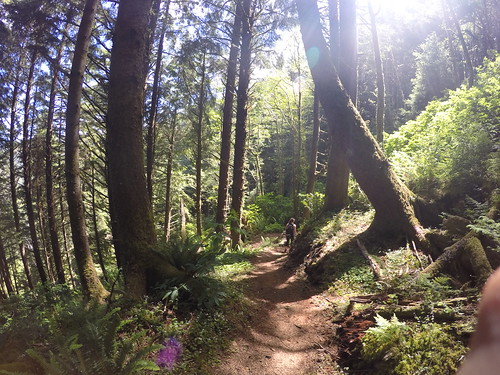
For the Fourth, the interns had the opportunity to go tide pooling (real verb, y’all) and hiking around Cape Perpetua! Listening to country while driving up a mountain, instead of hiking up to see the view was real American of us. But, we were able to hike on several trails at the top, so I got to soak in some good PNW forest-ness.
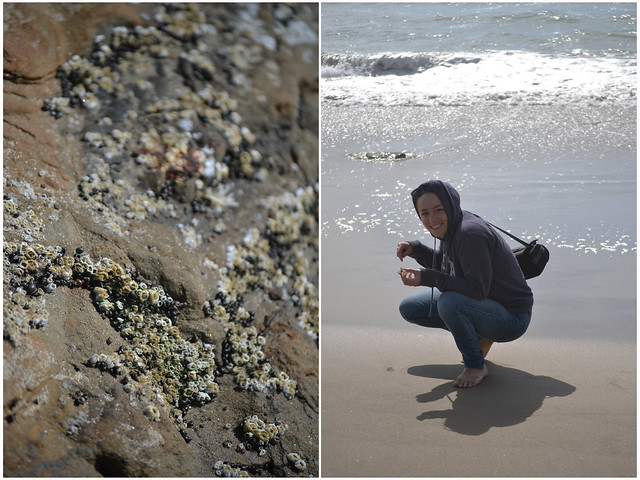
Here’s me being a dork on the Oregon coast:
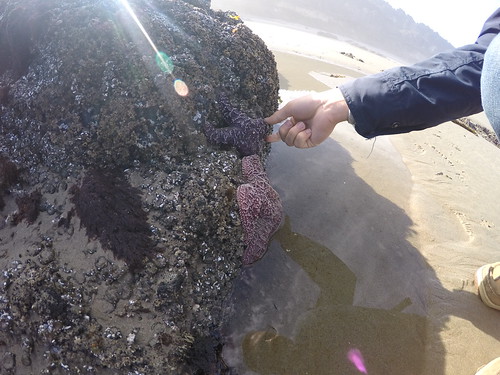
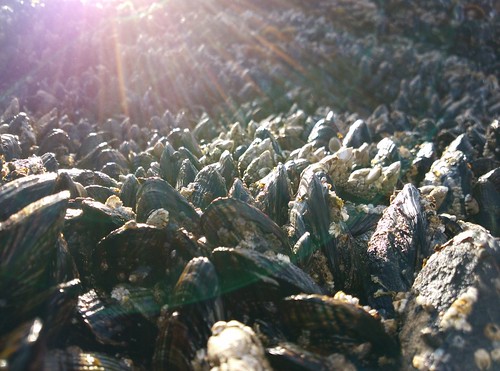
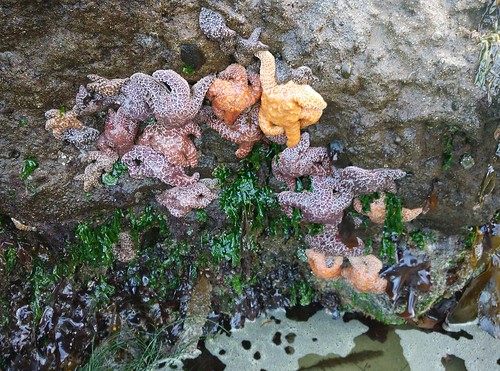
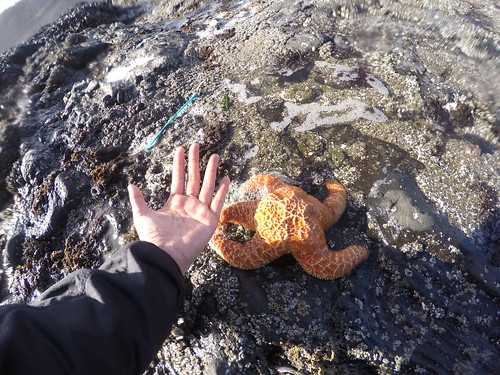
Adding Pisaster ochraceus to my goal list of species
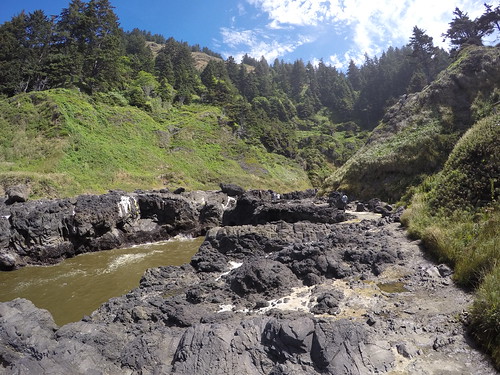
Then we got to visit Devil’s Churn on the way back…
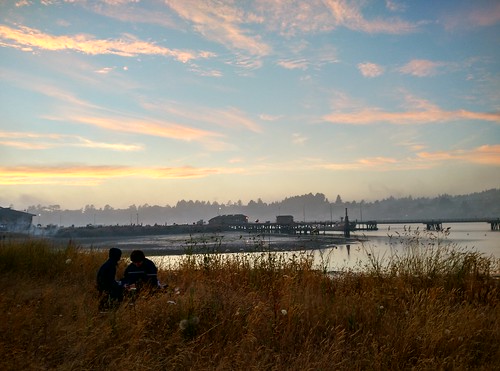
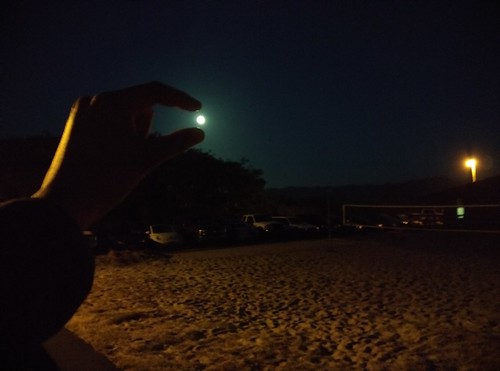
Waiting for the fireworks to start over the bay
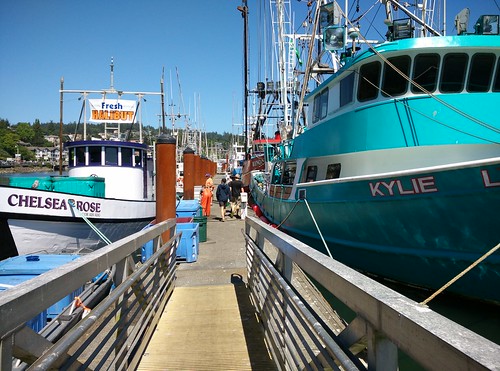
Thanks to the Chelsea Rose (pictured below) and some well-weathered fishermen, we bought the freshest albacore tuna, right off the dock. I try my best to strive to obtain all my food as locally as possible, with the least food miles tacked on– but I’ve never had the opportunity to buy fish, the freshest possible way. We’re definitely spoiled around these parts.
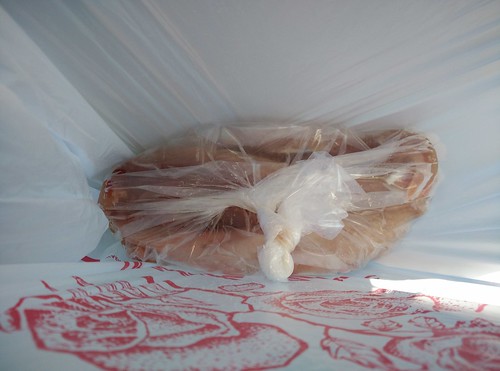
Before
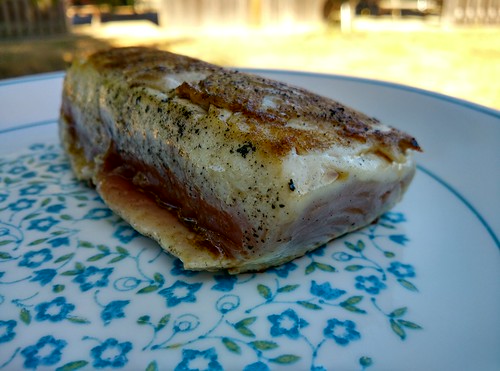
After
Mmmmm… seared to perfection.
Enjoy a couple more photos of life at HMSC:
Until next time…