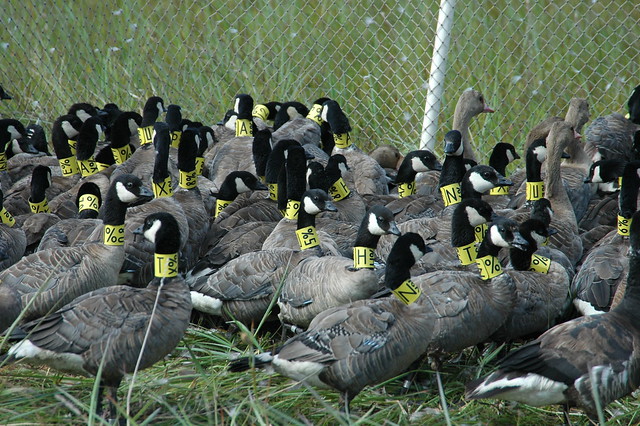
I will (hopefully) be exploring two different data sets in this course. My MS work (described in another post) does not contain any spatially explicit points, so work with programs like Arc becomes more difficult. For several of these analyses I will be using a dataset from the Oregon Department of Fish and Wildlife of cackling goose flock locations.
Cackling geese (Branta hutchinsii minima) are small-bodied geese in the Canada/cackling goose complex (http://www.sibleyguides.com/2007/07/identification-of-cackling-and-canada-goose/). The cackling goose is a is a migratory, Arctic breeding goose with breeding range primarily in the Y-K Delta of Alaska and wintering primarily in Oregon and Washington. Cackling geese are now the most abundant goose species wintering in the Willamette Valley. This follows the general explosion of most Canada goose and cackling goose populations in North America starting around 1966, but the range shift seen in cackling geese is unique coupled with the drastic increase in population size. The cackling goose has increased in number dramatically from an all-time low of less than 20,000 counted in fall surveys during the winter of 1984-85 to over 200,000 birds currently. Along with this population increase has come a change in winter distribution with significantly more use of Oregon and Washington instead of the Central Valley of California, with most birds being found in Oregon’s Willamette Valley and lower Columbia River. To reduce agricultural crop depredation, Oregon refuges have switched to habitat management practices to try and draw cackling geese onto refuge lands. There are also special hunting periods throughout the winter that may influence how flocks use available habitat. Interestingly, cackling geese have consistently been observed increasing their use of urban habitats such as golf courses, parks, sports fields, and residencies.
These birds have been collared on an individual basis since the mid-1990’s. While these data are used largely for mark-recapture analyses to gauge population size, it also produces a large number of flock locations throughout the winter within the Willamette Valley region. Within Oregon, the data spans 1997-2011 and contains 3,141 flock locations with associated latitude/longitude information. These data have been gathered opportunistically by state and federal personnel, and require a bit of data management beforehand.
Using these data, I hope to explore 1) if flock use has changed over the last 20 years, 2) if flock use changes throughout the winter, 3) what habitats feature flocks are most often using (refuge, agricultural, urban), and 4) if flock size changed over time or is influenced by habitat type.
To approach these questions, I would like to conduct several comparable hot spot analyses. I would like to produce a series of maps to provide to ODFW. Understanding flock use is important for resource managers as the population increase pushes birds into private agricultural and urban regions, and if use is changing over time.


